Drivers of loss: a way forward for biodiversity claims?
Here are some key takeaways
Holistic measurement of biodiversity is a significant challenge and stands as a barrier to the credibility of biodiversity claims within the voluntary carbon market and development of nature credits.
Focusing project success on addressing the threats or drivers of loss greatly reduces the number of variables to be tracked and better attributes project outcomes to the resources invested.
The limited number of drivers of loss is shared across all ecosystems globally, suggesting a greater level of fungibility and comparability between projects in different parts of the world.
Adoption of a threat intensity index would enable independent scrutiny and verification to take place, increasing market transparency and potentially releasing project developers from punitive cost overheads.
Contents
- Summary
- Introduction
- What drives biodiversity project activity?
- Five key drivers of biodiversity loss
- Measuring human threat intensity
- Swimming against the tide?
- Criteria for rating biodiversity credits
- Conclusions
Summary
Claims about the impact of conservation interventions are difficult to independently verify, which potentially leads to opacity in voluntary carbon and biodiversity markets. The issue is compounded by lack of fungibility between project claims and between project and corporate/investor measures of business impacts. Together, these effects are holding back the development of markets for added value carbon and biodiversity/nature credits.
An alternative, or complimentary, approach to measuring biodiversity impacts might be to quantify the reduction in human pressure on the project area attributable to the project activities. Threats can be assigned to a relatively small number of classes and quantified through in situ and ex situ methods. A commonly agreed upon index of threat intensity would enable investors to assess the relative merits of different projects.
Project developers could still make claims about specific biodiversity outcomes as part of the project narrative. However, the ability for independent third party verification of the project’s impact, via a threat intensity index, could help increase transparency and foster more rapid scaling of markets for biodiversity-related credits.
Introduction
Biodiversity claims are often made within the Voluntary Carbon Market (VCM) yet are usually unquantified and unverifiable. This leads to a lack of transparency and credibility of this investor-relevant aspect of the VCM, and will undermine efforts to spur the development of markets for standalone biodiversity/nature credits if it is not addressed.
Carbon is an inherently fungible unit. Other greenhouse gases can be converted into carbon dioxide equivalence (CO2e) through the use of conversion factors, and the impact of the release of one tonne of CO2e can be balanced by the capture of a tonne of CO2e elsewhere on the planet. Biodiversity is completely different: any given square metre of the planet’s surface hosts a unique assemblage of genetic material, that in itself changes in quantity and diversity over time.
Many methods have been designed to measure biodiversity, the majority of which depend on the taxonomic classification of life into various nested levels. The most basic of these is the species: although subspecies are frequently acknowledged, these are best viewed as population subdivisions of organisms that would not be fully reproductively isolated if brought into contact with one another. Related species belong to the same genus, related genuses belong to the same family and so on, with a set of kingdoms representing the broadest categories (Figure 1).
Categorising life enables sense to be made of the way it clusters into wider ecological structures, such as niches, habitats and biomes. Accordingly, additional measures have been created to capture aspects of species diversity at a given location or area. For example, alpha-, beta- and gamma-diversity are used to describe local species diversity, the ratio of local to regional species diversity, and total landscape species diversity, respectively.
Biologists have devised these approaches for the purposes of capturing aspects of biodiversity that happen to be of scientific interest. However, no single approach serves the more general purposes of the VCM, or of any nascent market for nature credits. There is no universally agreed approach to capturing the biodiversity “value” of whole ecosystems, or how this could be objectively compared across different systems, at different scales, over time. This is a subject of considerable debate among proponents of new markets, with some arguing that a “basket of metrics” approach is appropriate, others that individual project-based measures are sufficient.
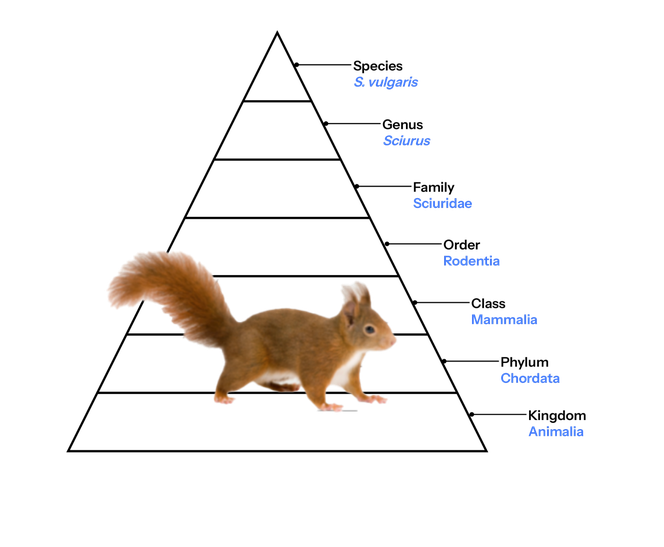
Figure 1. Taxonomic hierarchy for Sciurus vulgaris, the red squirrel. In some definitions an additional category, the Domain, splits the kingdoms between Eukaryotes and Prokaryotes.
The picture is further complicated when the interests of human stakeholders are taken into account. Local communities, usually those who are most impacted by the project activity or the activity the project aims to change, are frequently disenfranchised by lack of information or understanding about project objectives and in particular for being denied a just share of the financial benefits it generates.
Project monitoring must achieve a workable balance between the cost overhead of the monitoring regime and the information it yields. There is a generally positive relationship between monitoring costs and quality: this must be optimised to provide greatest project transparency with the least impact on its financial viability. This is proving a tough problem to crack.
In this report we ask whether the current focus on measuring biodiversity is actually the correct one. We begin with setting out a rationale for why projects happen in the first place and why they attempt to attract carbon finance, before going on to explore an alternative approach that might prove to be more fungible and less costly to implement.
What drives biodiversity project activity?
Biological conservation revolves around the protection and restoration of natural ecosystems and the species they contain. Born during the 19th Century in the United States of America through the actions of people such as John Muir and Theodore Roosevelt, the conservation movement has been driven by the perception of loss. Remarkable changes in North American wildlife populations, culminating in the near extinction of the buffalos that once numbered in their millions, inspired action to set aside areas of land to act as refugia for remaining wildlife and enable its recovery over time.
Scientists monitoring these areas began to devise techniques for quantifying observed changes, developing indices of biodiversity based around how the numbers of individuals, species, genera and so on at various spatial scales changed over time. Yet no single index captures all aspects of biodiversity nor the associated ecosystem services that benefit humans. Given the biological uniqueness of any point on the planet this is hardly surprising. It should therefore be equally unsurprising that efforts to develop biodiversity credits are struggling to identify the required common language.
The flagship species concept was born of the idea that it is easier to generate public interest and finance to “save” charismatic species than it is to protect whole habitats, even if doing the former means having to do the latter. Such flagship species tend to focus on mammals or birds, species that people relate to more easily than invertebrates, fungi and microbes.
This “preserved in aspic” approach can lead to the management of habitats for the primary and immediate benefit of the focal species, potentially to the detriment of others. It can be difficult to accommodate changes within reserved areas, such as climate change, or across the wider landscape, such as land use patterns that make the surrounding matrix more hostile to migratory species. Proponents make the counter argument that reserves act as centres of biodiversity that help to seed the surrounding area. Examples of both types of outcomes can be found in the conservation science literature.
Conservation projects exist to reduce human pressure on nature. In a sense, the precise biota present in an ecosystem does not matter as much as whether the system is functioning properly. At a certain level, such as at landscape scale, actions to verifiably reduce human impacts might mean that assumptions could be made about the recovery of ecosystem function over time.
More recently, the rewilding movement has shifted the traditional conservation focus. Rewilding is characterised by enabling ecological processes and function without proscribing the species that must be present. This approach arguably results in more favourable overall biodiversity outcomes, with ecosystems that are more resilient and adaptive to future change. The downside is uncertainty in the nature of the outcomes and the timescales over which they will happen.
The important distinction between traditional conservation and rewilding approaches is that the former attempts to provide protective refugia whereas the latter attempts to address the underlying reasons for the depleted state of wildlife. Much of rewilding action centres on “undoing” past human interventions, meaning that the bulk of the project costs are upfront. This creates a dilemma for rewilding efforts as funding is required before there are tangible outcomes.
The same may be true for biodiversity markets and nature credits. One way to address this is to recast the project aims in terms of reducing human impacts. This is also helpful in significantly reducing the complexity of measuring progress away from biodiversity per se and towards more tractable measures of human influence.
Five key drivers of biodiversity loss
Although loss of biodiversity can be driven by many factors, they fall into a relatively small set of categories. For example, the United Nations’ Environment Programme (UNEP) identifies five key drivers of biodiversity loss: invasive species, changes in land and sea use, climate change, pollution and direct exploitation of natural resources.¹
Invasive species
Invasive non-native species (INNS) are species that are transported by human facilitation, either deliberately or unintentionally, are able to become established and to spread with little or no resistance from indigenous species, and cause negative economic or environmental effects. The rapid spread of invasive species usually has deleterious effects on indigenous species and in the worst cases can threaten them with extinction. Many places experience threats from multiple INNS across different ecosystems, with the overall impacts tending to be multiplicative rather than additive (Figure 2).
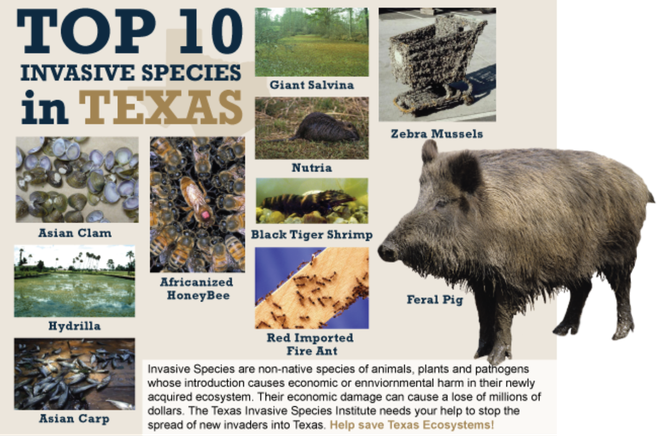
Figure 2. Example of a single US state² suffering multiple INNS simultaneous impacts. These are often subject to control measures that are quantified and tracked over time. © US State of Texas.
Deliberate introductions
Species have been deliberately introduced, either through explorers taking familiar species with them, primarily for food, or returning from newly “discovered” places with exotic new species. More recently invasive species have been deliberately introduced as efforts in biological control, or as ornamental species.
One of the most ecologically damaging deliberate introductions is that of the domestic pig Sus scrofa, which has become widely established to the detriment of local wildlife. Intelligent, highly adaptable and with a wide-ranging diet, feral pigs have been hugely disruptive to natural ecosystems all over the world.³
In the United Kingdom, the grey squirrel Sciurus caroliensis was introduced from North America as an ornamental parkland species. The squirrel’s rapid spread led to the near extirpation of the smaller native red squirrel Sciurus vulgaris through a combination of direct competition for resources and transmission of a pox virus that greys are adapted to but to which the reds are susceptible. The range of the red squirrel is now restricted to small, largely upland refugia and protected by intensive conservation efforts to keep grey squirrel numbers down.
Unintentional introductions
Marine ballast, usually in the form of sea water, is a major unintentional transmission pathway for INNS. The problem has increased with the globalisation of trade and has had major impacts on oceanic and coastal ecosystems.
For example, the large marine snail Rapana venosa is native to the northwest Pacific but in 1946 was discovered in the Black Sea. By 1998 it had spread as far as Chesapeake Bay on the eastern seaboard of the United States of America. It is now also established in both European and South American coastal waters. A predator on bivalve mussels, the snail has severely impacted shellfish populations in newly colonised areas.
Changes in land and sea use
Land use change has affected almost one third of the total global land area since 1960, driven primarily by agricultural production (Figure 3).⁴ The patterns of land use change are unevenly distributed both spatially and temporally but the majority are caused by a relatively small number of drivers, including climate change, globalised trade and economics. Climate change impacts will be dealt with in the following section, but the other major drivers are worth some discussion.
Globalisation of trade
Utilisation of land to produce food, fuel and fibre is the largest driver of land use change, but the last six decades have seen a decoupling of where production takes place and where the products are consumed. This process, known as telecoupling, has resulted in shifts in production created by distant sources of demand with important ramifications. For example, local/national efforts to promote sustainable land use might have the effect of exporting or offshoring production.
The impacts on biodiversity are profound. Centres of biodiversity richness are most often where land use pressure has historically been lowest, so the impact of displacement has been that modest biodiversity recoveries in heavily utilised parts of the world, such as the industrialised Global North, are outweighed by significant biodiversity losses in places where there is little or no enforced environmental regulation.
Globalisation also has the effect of concentrating supply sources, intensifying local pressures beyond what they would otherwise be in the absence of long distance trade. This accelerates the rate and extent of change, making recovery in the longer term even more difficult, and requiring greater levels of resourcing to realise success. Globalisation is closely linked to economic growth, meaning that countries with the greatest extent of “unutilised” land have the most to gain from its conversion.
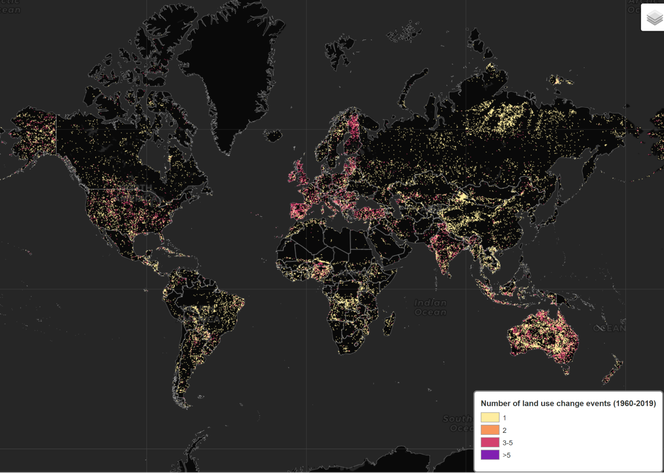
Figure 3. Intensity of land use change since 1960 (from HILDA+, the global HIstoric Land Dynamics Assessment⁵). Land use change events are deemed to occur when a pixel transitions between two of six broad land use categories: urban, cropland, pasture/rangeland, forest, unmanaged grass/shrubland and sparse/no vegetation.
Economics of telecoupling
Global economic cycles can have dramatic impacts on land use. For example, growing urbanisation and its associated prosperity can drive demand for agricultural production, particularly for meat. This has historically resulted in large scale deforestation in the tropics, industrialising a process that was previously driven by small scale slash and burn agriculture. Conversely, economic recessions can cause land abandonment, which can be beneficial to biodiversity.⁶
The framing of policies is critical in managing land use change to reconcile the interests of, for example, food production and forest protection. Measures to increase land use efficiency (not necessarily intensity) can be effective in reducing uncontrolled conversion. Regulatory instruments such as land zoning and dependence on import/export routes, including overseas investment and finance, can help to limit the impacts of a globalised economy. Some developing countries have, accordingly, managed to strike an acceptable balance between the different tensions on land use that have simultaneously created more sustainable food production and better environmental protection.⁷
Climate change
Shifts in habitability are one of the most noticeable impacts of a rapidly changing climate. These changes cascade: as the composition and distribution of plant life changes, so then do the animals and other species that depend upon them. The general response, depending on rainfall patterns, is for shifts to higher latitudes and altitudes, which in some cases can create a more fragmented landscape, in turn affecting genetic viability of populations.
Increasing incidence and severity of climate related events, such as droughts, floods and fires, can place natural ecosystems under greater stress than they are able to cope with. This paves the way for some species to dominate ecosystems: pests and pathogens, particularly those without local checks and balances, are able to become invasive.⁸ Resulting ecosystems may be impoverished and simplified, making them still more vulnerable to further climate impacts.
Ecological heterogeneity has been shown to correlate with resilience, including to the impacts of climate change.⁹ This again indicates the capacity for stressors to interact: ecosystems that have been simplified through INNS or land use, for example, are more susceptible to climate change impacts that will further weaken them.
Pollution
There are many types of pollution that impact on air, land and water, and the living organisms they contain. Air pollution resulting from human activities includes the release of greenhouse gases such as carbon dioxide, methane and hydrofluorocarbons. Acid rains contain elevated levels of nitric and sulphuric acids, cause damage to forests and aquatic ecosystems, and trigger cascading mechanisms such as increased aluminium absorption from soils, which increases toxicity to many species.
Additional sources of water and soil pollution include from agrichemicals and fertilisers, as well as from mining activities such as oil, fracking and mineral extraction.
Other pollutants include radioactive, noise, light and thermal sources. These all impact on ecosystems, being either directly deleterious or weakening them and increasing susceptibility to other stressors such as invasive species or pathogens.
Abatement of pollution generally demands a combination of regulatory legislation and active enforcement. The latter requires the means of detection, which can be achieved through the use of surface measurements such as air and water quality detectors. As technology advances it is increasingly possible to detect some kinds of pollutants through remotely sensed data.
Direct exploitation of natural resources
Utilisation of natural resources for food, fuel and fibre often exceeds the capacity of the system to replenish, particularly in densely populated areas or where demand for a particular product is high. Primary examples are deforestation and forest degradation for timber or charcoal, and collapse of fisheries due to over-exploitation.
Natural ecosystems are generally sufficiently resilient to be able to rebound from disturbance. Easing pressure on them will usually allow a return to the original state of equilibrium. However, over-exploitation risks tipping the system into an alternative state from which recovery is no longer possible without intervention.
Measuring human threat intensity
While measures and metrics for some aspects of biodiversity can be relatively straightforward to capture, weighting them to enable the meaningful comparison of different systems is not. For example, a species’ local extinction probability might be tracked over time within a geographically bounded area, but how might that ecological risk be compared to the extinction threat faced by another species? How are individual species’ “contributions” to the ecosystem as a whole to be ranked?
This inherent difficulty in obtaining comparative measures of biodiversity has stymied the development of biodiversity or nature credits. The problem is compounded by the fact that the more detailed the analysis becomes the more costly it is to carry out. This creates an unwelcome tension between the quality of data for a project and the cost overhead of providing that data.
Given that conservation actions are motivated by the observation that human activity is impacting negatively on an ecosystem, and that those activities are identifiable and thus quantifiable, an alternative to measuring biodiversity is to track the intensity of the human impacts upon it.
In situ measures
On the ground measurement of human activity can be undertaken through manual surveys or through the use of devices that are rapidly increasing in sophistication and capability. Examples of such technologies include:
Camera traps
Although fixed “trail” cameras have been in use for many years, they are increasingly being coupled with other technologies that assist in the capture, communication and interpretation of images. The transition from film to digital formats took place some time ago, but technical developments such as improved battery life, improved image capture, and connection to mobile networks are greatly increasing their utility.
Camera traps can be used to monitor human presence, quantify human activity, identify human impacts on wildlife and monitor the effectiveness of conservation interventions. Data can be analysed in a variety of ways including simple counts and activity indices. Networks of camera traps enable both spatial and temporal modelling to identify areas where threats to wildlife are greatest, and how these threats are changing over time.
Acoustic sampling
Acoustic sensors have been used to identify species presence and the wider ecological soundscape, having the advantage of effectively being able to monitor large spatial areas.¹⁰ However, they can also be used to identify and classify types of human activity such as gunshots, chainsaw use and vehicle movements.¹¹
Because these devices essentially monitor the whole environment, the data they collect can be analysed in a variety of ways. For example, correlations between both human activity and the presence or absence of target species can be determined. Machine learning and AI systems are increasingly used to conduct analyses. This separates the cost overhead of the installation and maintenance of the recording devices from the interpretation of the data, which could be important to the financial viability of the project.
Environmental DNA
All living organisms constantly shed genetic material, DNA, into the environment. Samples collected from air, water and soil can be analysed to determine the presence of species. This use of environmental DNA (eDNA) has been particularly helpful in identifying otherwise cryptic or rare species, but can also be used to establish whether invasive species or pathogenic organisms are present.
There is some evidence that microbial community structures shift in response to pollution and other environmental stressors. This is an area of active research that raises the possibility that eDNA might be a useful approach in detecting pollution and disturbance events.
Pollution sensors
Sensors can be used to detect a wide range of pollution sources in situ. These include:
air quality (e.g. particulate matter, ozone, nitrogen dioxide, sulphur dioxide, carbon monoxide);
water quality (e.g. bacteria, viruses, chemicals and heavy metals);
soil quality (e.g. pesticides, herbicides, fertilisers and heavy metals);
noise (e.g. from traffic, construction and aircraft);
radiation (e.g. alpha-, beta-, gamma particles and x-rays);
thermal influences (e.g. outflow from nuclear or industrial processes).
Mobile applications
The use of mobile phones to collect biological and social survey data has increased dramatically in recent years, as a result of their increased ubiquity, better performance and continued rollout of cellular coverage. Onboard data capture can be manually inputted or collected through the phone’s array of sensors (some modern phones even have LiDAR). Data can be time and location stamped using the internal GPS and remotely uploaded to a central processor and database. Artificial Intelligence and Augmented Reality can help increase the effectiveness of data capture and provide a more immersive user experience, which itself can lead to greater uptake.
The use of personal devices could also facilitate novel avenues for project effectiveness. For example, capturing and submitting an authenticated record of a species of conservation concern, or sustainable resource use, could trigger a micro payment to that user’s bank account. This could bolster incentives to protect the habitat and invest effort in monitoring threats.
Remotely sensed data
Remotely sensed data from satellites, fixed wing aircraft, drones or any other non-contact platform can be used to infer human threat intensity and impacts on ecosystems. For example:
land use and land cover: remote sensing can be used to map land use and land cover change, providing insight into how human activities are transforming natural ecosystems. For example, remote sensing can be used to track the expansion of agriculture and regenerative farming practices, patterns of deforestation, and urbanisation;
vegetation health: monitoring factors such as leaf area index, chlorophyll content, and water stress can help to identify areas where plants are being impacted by threats such as pollution, overgrazing, and climate change;
wildlife habitat: remote sensing can be used to monitor changes in the extent and condition of habitats, such as forests and wetlands. For example, changes in fire activity, canopy cover or the vertical structure of forests, outside the range of natural variability, can be indicative of habitat disturbance and exploitation.
pressure maps: data on human infrastructure (e.g. buildings, roads, railways, canal networks), population density and demographics, terrain complexity, mobile gps tracks and so on, can be combined to map and monitor how human pressures on ecosystems are changing over time;
water quality: parameters such as turbidity, chlorophyll concentration, and nutrient levels can all be assessed using remote sensing;
air quality: parameters such as ozone levels, nitrogen dioxide levels, and particulate matter concentrations are accessible from remotely sensed data sources. This information can be used to identify and address sources of air pollution.
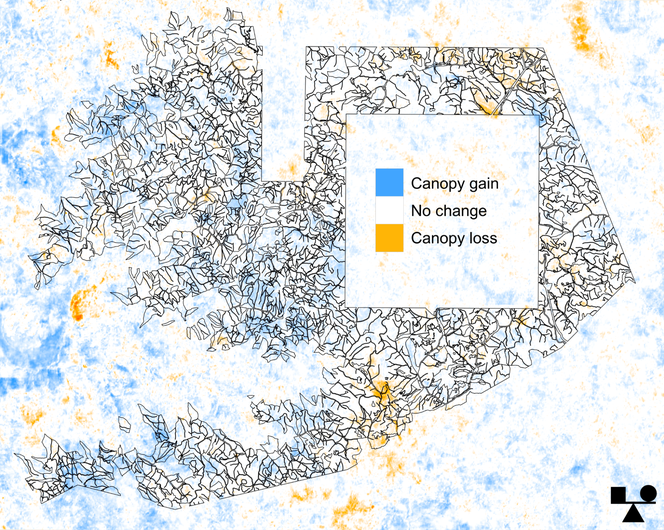
Figure 4. Tree canopy gain and loss, in and around an improved forest management project in rural Mexico. Maintaining canopy cover is crucial for forest-dependent species in the understory. Black lines show ejido land parcels enrolled in the project. Mapped at 3-m resolution using data from Planet and BeZero.
Swimming against the tide?
There is building momentum for the development of nature credits, apparently driven by corporate demand: businesses are increasingly considering their wider environmental impacts beyond greenhouse gas emissions. However, whereas the carbon market is well established and carbon finance firmly on the balance sheet, most finance for biodiversity-related activity is through corporate social responsibility budgets.
While metrics for biodiversity are undoubtedly important, they introduce two major impediments to the development of nature markets. First is the lack of fungibility: the particular biota present at one place at one point in time is unique. At the same location, changes over time can be monitored and quantified relative to one another but it is generally not possible to say how change in one place ranks against change in another, especially when the magnitude of change is small.
The second impediment is that, for a corporate to respond proportionately (i.e. to spend neither too much nor too little), it must have the means to quantify its requirements in a way that is compatible with whatever metrics are being used by the nature credit supplier. Again, the uniqueness of biodiversity measures makes this all but impossible and will stifle market scaling.
Switching things around and focusing on quantifying the drivers of loss provides the basis for a framework that addresses both of these issues.
Advantages of driver-focused approach
Conservation outcomes usually lag behind interventions, sometimes by decades. This presents a funding barrier if investors need to see results before financing projects. On the other hand, actions to reduce anthropogenic threats are more immediately quantifiable, even if it takes time for the ecosystem to subsequently adjust to the more benign conditions.
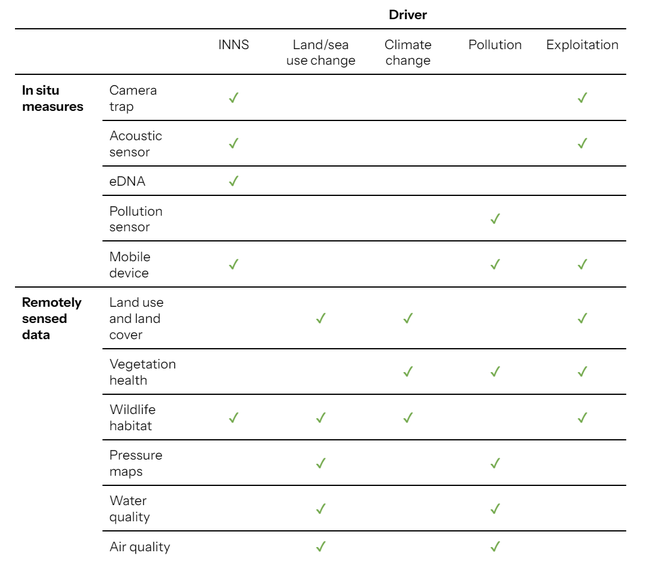
Table 1. How each of the data capture methods can provide information on the five drivers of loss.
The limited number of threat categories described above suggests the possibility of developing a threat intensity index, which would enable the relative impacts of different projects to be compared. It would also provide a framework by which corporate investors seeking to mitigate their operational impacts quantify them. In other words, a threat intensity index creates a fungible metric analogous to carbon dioxide equivalence (CO2e) in greenhouse gas markets.
Many drivers of loss are quantifiable using remotely sensed data or remote monitoring of in situ devices (Table 1). This has advantages in terms of reduced data collection costs, repeatability (i.e. ongoing monitoring, possibly even in near real-time), and in spatial and temporal consistency.
Disadvantages of driver-focused approach
If the damage has already been done, such as the introduction of INNS, efforts must focus as much on the removal of target species as the prevention of the arrival of new ones. Conservation interventions therefore need to be aligned with threat abatement.
Modelling might be required to forecast the outcome of the threat abatement activity. This is a specialist field in mathematical ecology unlikely to be within the skill set of the project developer, and therefore would need either academic collaboration or outsourcing, adding to project overheads.
Example 1. The STAR framework
One model that has attracted attention is the Species Threat Abatement and Recovery (STAR) framework.¹² It is based on the IUCN Red List of Threatened Species, which provides information on the distribution, threats and extinction risk of over 140,000 species. The focus on avoiding species extinctions suggests the framework would not be suitable for all biodiversity claims, but it might contribute to a wider assessment for the area or region.
Proponents claim that the STAR framework is quantitative, scalable, comprehensive and transparent. Detractors counter that the data requirements are costly and time-consuming, that the method is complex and does not replace expert judgement. As a specialist conservation tool, therefore, the framework might have merit in helping identify where to focus conservation effort and track progress, but is perhaps less suited for widespread use as a metric for biodiversity claims within voluntary carbon or related markets.
Criteria for rating biodiversity credits
With the current emphasis on measuring biodiversity the focus has been on what happens within project boundaries. However, following the example of the VCM, other aspects of a project need to be considered to assess the credibility of its carbon claims. The same is true for biodiversity.
Risk factors that impact on the likely outcome of a carbon project include:
Additionality: demonstrating that the sequestration or ongoing storage of carbon would not have taken place without the project activity.
Permanence: demonstrating that the project outcomes will be sufficiently long lasting, if not permanent then at least the duration of the project’s commitment period, and with risks of reversal identified and mitigated through intervention or buffer contributions.
Leakage: demonstrating that the project does not merely displace damaging activities to another place, or to the extent this is likely, mitigating the risk through intervention or deductions of issuance.
Over-crediting: demonstrating that the methodology used in assessing the carbon uplift is not overly optimistic, resulting in the issuance of more carbon credits than tonnes of CO2e sequestered or avoided.
Policy landscape: showing that a project happens despite the prevailing government policy or enforcement regime, rather than because of it.
These same risk factors will form the basis for rating nature or biodiversity credits, yet over-crediting is the only one directly related to on-site measurement of carbon or biodiversity. For markets to scale and mature, transparency must be maximised, suggesting that an urgent focus on how to evidence these risk factors is at least as important as developing methodologies for measuring biodiversity.
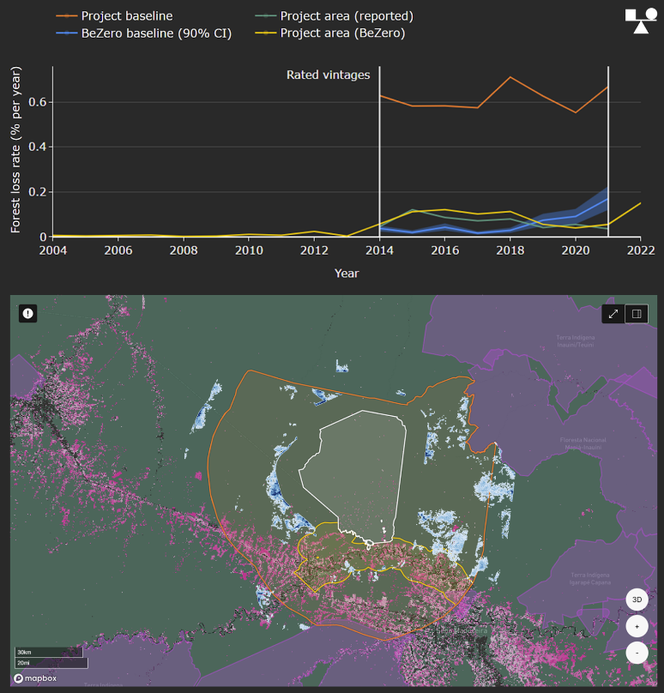
Figure 5. For credit ratings in the VCM, monitoring what is happening beyond the project area is a key component of assessing project claims. Example shows an avoided deforestation project in Brazil, where the project’s baseline (orange) is overestimated relative to statistically-matched control sites (blue). Map shows the locations of control sites (blue pixels); project area mapped in white, project’s reference region in orange, deforestation in pink, and protected areas in purple. © BeZero Carbon Ltd 2024.
Several of the factors above require areas and time-series beyond the project activity to be assessed. In the context of the VCM this challenge is addressed through the use of baselines and reference areas (Figure 5). If direct monitoring of biodiversity is onerous within a project area, it will only be more so if additional areas must also be surveyed, compounded by the need for historical data in both the project area and control sites. This will further impede the financial viability of projects.
Conclusions
The ongoing debate around what measures of biodiversity are relevant is impeding the development of markets for nature-based credits, yet the rate of biodiversity loss continues unabated. Ecologists did not design biodiversity metrics with a view to credits or markets; indeed, many still find the concept unpalatable. Yet without a quantitative approach investment decisions will be limited to project documentation and whatever checks the issuance body makes, just as for the VCM prior to the advent of independent ratings.
By focusing on the drivers of loss, which often provide the motivation for conservation action in the first place, the variables that need to be quantified can be reduced to a more tractable number. Human activities and the threats they pose to nature are more fungible than measures of biodiversity, potentially enabling quantification of corporate impacts to be aligned to investment in biodiversity projects.
Crucially, the approach outlined above separates project-specific biodiversity claims, which can only really be verified by repeated ground-based sampling, from independently verifiable measures of wider project impacts. Threat intensity metrics need not replace biodiversity claims, but could act as a parallel marker that helps investors to discriminate more effectively between projects.
References:
¹ 5 key drivers of the nature crisis (unep.org)
² Invasives 101: Texas State Invasives Institute (tsusinvasives.org)
³ Invasive predators and global biodiversity loss - PMC (nih.gov)
⁴ Global land use changes are four times greater than previously estimated | Nature Communications
⁵ Land Change Stories – data-driven views of our changing planet
⁶ Experiments in Globalisation, Food Security and Land Use Decision Making | PLOS ONE
⁷ Global land use change, economic globalization, and the looming land scarcity | PNAS