
Ahead of the (carbon) curve: understanding project delivery risk
Key takeaways
Market actors, with the help of ratings, can find quality in carbon markets, but project delivery risk remains a major concern, necessitating a comprehensive assessment of future carbon curves, implementation and operational risks.
We show how BeZero Carbon combines geospatial analytics, ecological modelling, market insight, and project-level diligence to deliver industry-leading assessments of carbon curves across nature- and technology-based projects.
Long-term investors, risk carriers, offtakers, governments and others making long term project commitments can use carbon curve analysis to model and price delivery risk.
This article explains how BeZero Carbon uses carbon curve analysis - our quantitative assessment of projected emissions reductions or removals. This forms part of our evaluation of project delivery risk (the risk that a given project will fail to issue the predicted volume of credits) in nature- and technology-based carbon projects.
⠀
Why the market needs better delivery risk assessment
Now that the market, with the help of ratings, is able to find quality, a key challenge remains for suppliers and buyers: assurance they're going to be able to supply and procure the volumes they need. That's where BeZero carbon curve analysis can inform investment and buy-side decisions.
For the developers and backers of proposed carbon projects, two major categories of risk will inform their view on how bankable a project design is: value risk and volume risk. Value risk relates to the quality of each future credit the project intends to issue. This will reflect a range of attributes including carbon efficacy, alignment with market standards and benchmarks, and social and nature impacts. These quality attributes underpin the value of the carbon credit, being important drivers of demand and price. Since the launch of BeZero’s ratings in 2022, there has been a growing relationship between price and ratings, with recent analysis showing that buyers are willing to pay more for higher quality, lower risk projects.
Volume (or delivery) risk considers how many future credits the project will produce. For project backers it is essential to assess the risk that actual and forecast carbon credit issuance will diverge. This is particularly pertinent given the frequent complexity and long timelines for carbon project investments.
Data from BeZero’s Issuance Risk Monitor illustrates the point. This database compares actual and predicted issuance for 1,756 carbon projects globally. The median project in the database has under-delivered, with issuance delivered at 83% of the forecast level. 35% of projects have under-delivered by 30% or more. Delivery risk outcomes are also widely distributed. 21% of projects exceeded forecast issuance by at least 10%. Just one fifth of projects realised issuance within +/-10% of forecast.
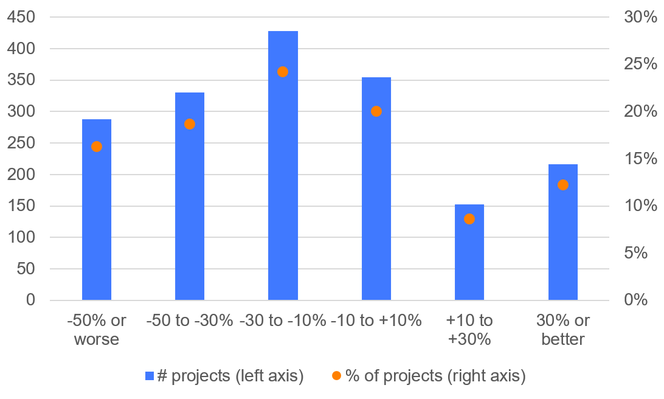
Figure 1. Distribution of projects by historical over and under-delivery (realised issuance versus ex ante forecast issuance). Source: BeZero Carbon Issuance Risk Monitor.
The intense focus on carbon credit integrity in recent years has supported important steps forward in quality guardrails and in the ecosystem to assess value risk. This includes ratings and other carbon risk management tools.
The toolkit to assess volume and delivery risk similarly needs to continue evolving in sophistication for carbon markets to realise their full potential. Quantifying the risk of realised volumes under-delivering against forecasts is crucial for all stakeholders: for investors to predict returns; for lenders to assess credit risk; for insurers to underwrite effectively; for buyers to have confidence that future supply will meet their commitments; and for developers to gauge project viability.
The delivery risk toolkit starts with quantitative models that predict the likely carbon yields over time for a given project type. These carbon curves will vary by project type but all seek to model the range of likely carbon reductions or removals over the project lifetime. The full delivery risk assessment combines carbon curves with often more qualitative assessments of implementation, operational and external risks.
⠀
What carbon curve analysis is and why it matters
Carbon curve analyses are distinct from, and complementary to, assessing carbon accounting risk. Carbon curve risk refers to the possibility that a project’s planned emission reductions or removals are overestimated, such that future verification results in fewer credits being issued than initially forecast. Carbon accounting risk, by contrast, refers to the risk that the accounting underpinning a credit — after issuance — does not fully represent a tonne of CO₂e avoided or removed, for example due to over-crediting or leakage. In short, carbon curve risk concerns volume risk, while carbon accounting risk relates to value risk upon issuance.
The drivers of carbon curve risk may be either sector-specific, such as sequestration rate assumptions in Forestry projects, or common across different sectors, such as implementation delays. The carbon curve analysis is the core quantitative component of a project’s broader delivery risk assessment, which combines it with more qualitative factors to evaluate the overall risk of under-delivery — that is, the potential shortfall between projected and actual carbon credit issuance. These additional considerations include jurisdictional risk in the country or region where the project is located, as well as sectoral benchmarking based on the historical performance of comparable projects.
Carbon curve analyses offer crucial insights across various investment processes. Equity investors use these assessments to evaluate the robustness of projected internal rates of returns and to stress-test payback periods. Lenders and debt investors, on the other hand, rely on them to assess whether debt service coverage ratios and other key financial metrics are likely to exceed pre-determined thresholds. This, in turn, provides the confidence needed to deploy significant amounts of capital, in a manner analogous to the use of P90 analyses in renewable energy projects.
For buyers, carbon curve assessments are relevant in two main ways. First, where buyers rely - at least in part - on carbon offsets to meet their climate targets, future under-delivery of credits could jeopardise target achievement. Identifying this risk early allows buyers to adjust their carbon credit procurement strategies accordingly. Second, when structuring and negotiating offtake agreements with project developers, these analyses inform both contract sizing and the inclusion of appropriate under-delivery clauses and provisions.
⠀
How BeZero conducts carbon curve analysis
Carbon curves are critical to estimating future issuance of Afforestation, Reforestation, and Restoration (ARR) projects. Forest growth is determined by natural factors, such as climate, soils, and species planted, as well as management practices, such as natural regeneration, assisted natural regeneration, or full-scale active planting. Each curve therefore needs to be tailored to the project’s activities, whether these are centred around production forests or ecosystem restoration.
At BeZero, we leverage a range of public and proprietary datasets to construct carbon curves from satellite observations, field data, and literature. Our partnerships with Planet Labs and Chloris Geospatial provide access to state of the art estimates of remotely sensed carbon stocks, while the BeZero Carbon Plots Database collates field measurements and associated forest attributes from 350k sites globally.
We combine these data with information on forest age to parameterise growth equations, and use spatial stratification to align with environmental conditions and project activities. Our remote sensing scientists, statisticians, and forestry experts evaluate these curves and their respective uncertainties, relative to the project’s own carbon curve assumptions, to inform our view of delivery risk.
In the example below, we compare project-reported growth estimates to those derived from field observations and remote sensing. The project implements a combination of natural regeneration and assisted natural regeneration. We find that, compared to field observations of natural regeneration in the region, the project may overestimate carbon accumulation over its 40-year crediting period by 30% (credible interval: 12-56%). However, risk is tempered by the project activities that assist regeneration in some areas, compared to natural regeneration alone.
A second carbon curve, based on satellite remote sensing, shows larger overall uncertainty. Interestingly, satellite observations suggest that some forest carbon stocks typically remain present on the landscape due to incomplete clearing, which may lead to over-crediting if not accounted for.
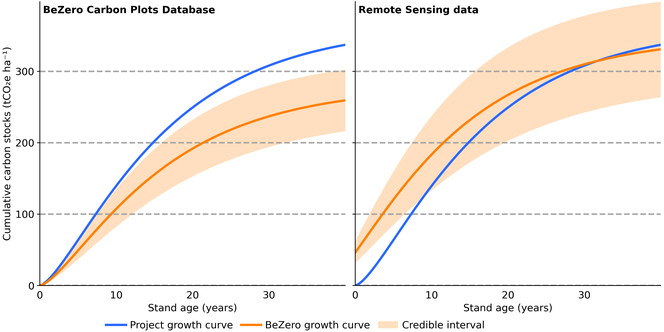
Figure 2. Comparison of carbon curves for an illustrative ARR project. Data source: BeZero Carbon.
Turning to the Technology-based Solutions (TBS) sector, different project types and technologies naturally have distinct drivers of expected future credit issuance volumes. For example, in cookstove projects, the carbon curve is primarily driven by the number of stoves distributed and the fuel types they use and replace; in biochar projects, it depends on the deployment of pyrolysis units and access to reliable feedstock supply; while in landfill projects, it is shaped - among other factors - by the volume of waste processed over time.
To illustrate how carbon curve risk is quantified in practice for TBS projects, we focus on the African cookstove sector. Using BeZero’s Project Fundamentals and Issuance Risk Monitor data, we observe a strong positive correlation between ex post credit issuance relative to forecast and stove distribution relative to forecast (Figure 3). This implies that, all else equal, under-distribution of stoves is a key driver of future credit under-delivery.
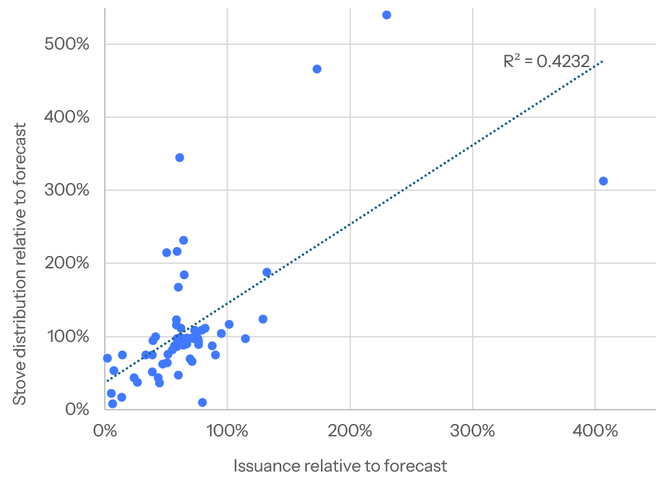
Figure 3. Relationship between ex post credit issuance relative to forecast and stove distribution relative to forecast. The total number of African cookstove projects included in the analysis is 65.
Consider a cookstove project that plans to distribute 100,000 stoves over a 4-year period, with each stove expected to operate for 5 years. Relative to the project’s carbon curve assumptions, our analysis identifies three main sources of risk: a potential 6-month delay in project start due to supply-chain bottlenecks; staffing constraints that may limit stove distribution in the first year to around half of the planned volume; and a saturated local market that might cap the project’s ultimate scale at approximately 80,000 stoves.
Taken together, these factors result in a more conservative carbon curve. Comparing this revised curve with the original forecast highlights potential delivery shortfalls of around 31% over the first 5 years and 20% over the project’s full lifetime (Figure 4). This analysis, alongside the other qualitative considerations that feed into a project’s comprehensive delivery risk assessment, plays a critical role in informing due diligence for offtakers, insurers, and investors.
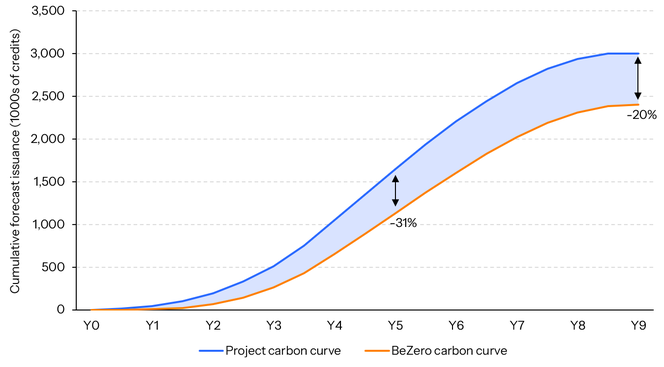
Figure 4. Comparison of carbon curves for an illustrative cookstoves project. Data source: BeZero Carbon.
What carbon curve insights mean for investors and market participants
Delivery and carbon curve risk assessment has come more sharply into focus in recent years. A number of trends have underpinned this. First, market activity has transitioned upstream in recent years. There is now significantly more focus on early-stage investment relative to secondary trading in issued credits. Understanding future volumes becomes essential to modelling the value and risk in future project revenues from offtake agreements that are negotiated today.
Second, compliance and Article 6/PACM markets are emerging as important market mechanisms. Governments and regulators that seek to provide scheme approval to projects need to ensure those projects can deliver against expectations if industry or national emissions targets will be met.
Third, the carbon market continues to see innovation in the financial services ecosystem serving it. This includes innovations and evolution in insurance solutions, development finance, bank lending, bond financing and portfolio investment structures focused on carbon markets. Carbon curve and delivery risk modelling techniques are essential to the risk return frameworks for each of these stakeholders.
Carbon ratings have emerged as a key tool to assess risk and inform quality assessment in carbon markets. Our recent review of carbon carbon markets in 2025 highlighted how the carbon market continues to shift towards higher-rated retirements, including within specific sectors. Moreover, higher-integrity credits have become more scarce as buyer preferences shift towards quality. For higher-rated credits, the market has already passed a tipping point: since 2022, retirements have exceeded issuance for credits rated ‘A’ or higher and ‘BBB’ or higher, leading to a sustained drawdown in available higher-integrity supply.
Robust analysis of carbon curves and delivery risk to model volume risk complements ratings as the barometer of value risk. Forecasting future project performance ultimately needs both. This is especially relevant in a market that is seeing scarcity in high-quality supply combined with continued surplus in lower quality credits.
Learn more about BeZero’s ratings, including pre-issuance assessments of carbon risk, project execution and delivery risk, and actionable risk feedback. If you have any questions, get in touch.