Landfill gas projects deep dive: Pick of the dump
Here are some key takeaways
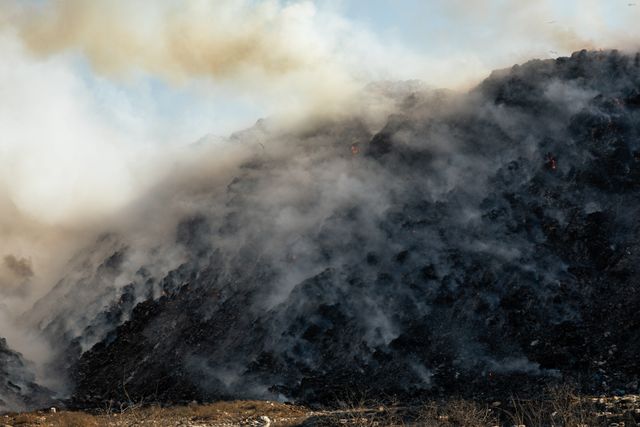
Landfill gas (LFG) projects avoid emissions from decaying landfill waste by combusting collected methane and/or converting gas to energy. Our previous insight gave an overview of landfill gas projects, and how project locations and operating conditions influence their ratings.
This report investigates how LFG projects calculate emissions reductions (ER’s); how landfill characteristics may affect LFG generation and recovery rates; and discusses whether the use of default values in ER calculations accurately reflect landfill attributes.
We argue that variations in how projects estimate LFG generation and recovery, such as methane oxidation, landfill cover type, and climate, can drive over-crediting risk.
Contents
Part 1 – How are LFG emissions calculated?
A good rule of thumb for LFG emissions is that they comprise 50% carbon dioxide (CO2) and 50% methane (CH₄). CH₄ is between 27-29.8 times more potent than CO₂ depending on the source, which is reflected in the most recent Global Warming Potentials (GWP) published by the Intergovernmental Panel on Climate Change (IPCC).¹ In this section, we look at how LFG emissions are calculated, including key parameters, models and methodologies.
The calculation
Emissions reductions (ER’s) in LFG projects are calculated using a complex formula that takes into account landfill specifics. These typically include waste decay rates, climate, temperature, and precipitation. An example equation taken from the US-based Standards Body Climate Action Reserve (CAR) is shown in Figure 1. Note: most parameters are consistent across methodologies, but specific calculation methods vary between Standards Bodies methodologies.
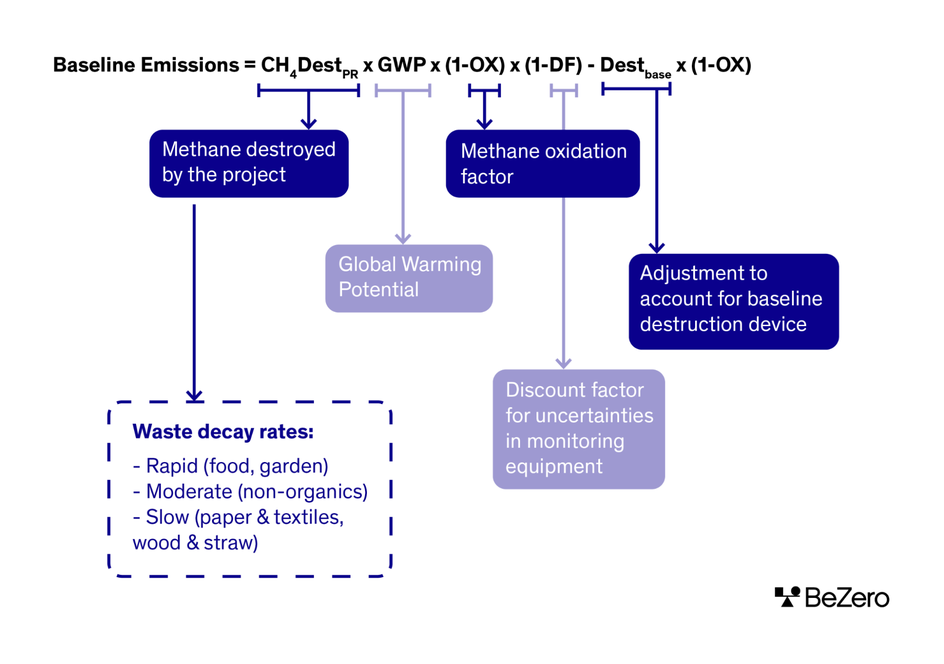
Figure 1: Example of baseline emissions calculation (Climate Action Reserve)
Not all parameters within ER calculations are calculated on a landfill specific basis. In most cases, default values are used. The most common parameters associated with default values are listed below:
GWP꜀ₕ₄ - methane global warming potential
OX - methane oxidation factor
Collection efficiency (abbreviation varies with methodology)
Table 1 also highlights how projects make use of LFG ER parameters, and their potential effects on crediting.
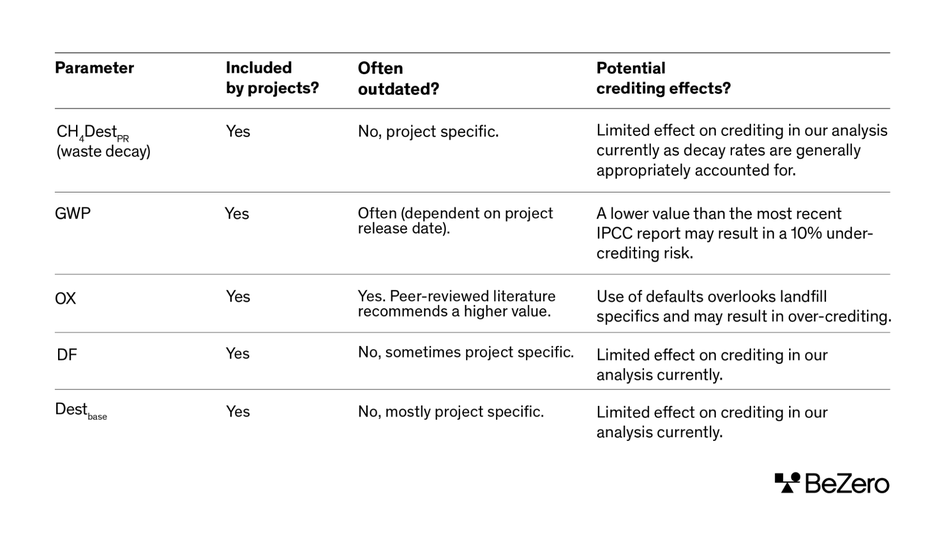
Table 1: Summary of LFG ER parameters
Our research finds that the default values applied to cover the above parameters (GWP and OX) may be inadequate as they are unlikely to accurately reflect the real-life scenario occurring at the individual landfill sites²:
The GWP values are substituted from the IPCC assessment reports which are updated every 6-9 years.³ The use of a lower GWP in ER calculations likely underestimates a projects’ issuance, as theoretically, projects could have issued more credits under newer and higher GWP values by as much as 12%.
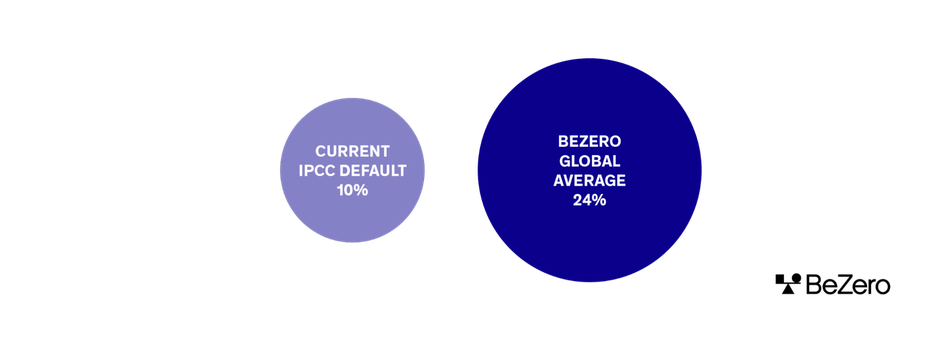
Methane oxidation rates have been recommended by the IPCC and the United States Environmental Protection Agency, but this value can also vary between methodologies. The most commonly applied methane oxidation factor is 10%. However, peer-reviewed literature has suggested that this value may be too low to accurately account for environmental factors which influence methane oxidation². This may present an over-crediting risk.
LFG collection efficiency defaults are typically between 50-95% depending on the Standards Body, methodology and model type. Collection efficiencies vary significantly between countries (Figure 2) and technologies applied. The 50% default may be sufficient for some countries and technologies but not all. For example, the UK can have collection efficiencies up to 70%,⁴ meaning the 50% default may understate ER’s and ultimately lead to under-crediting.
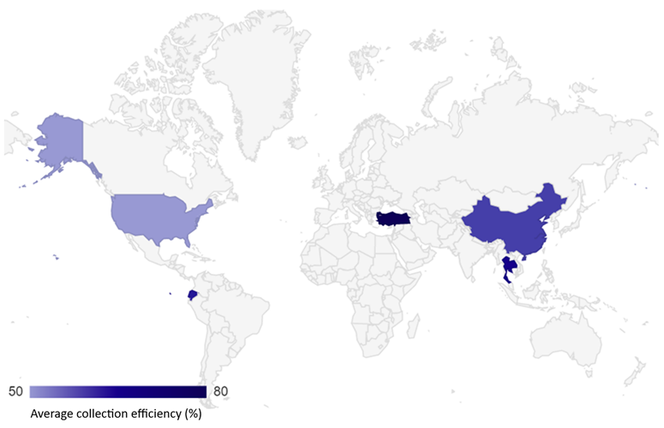
Figure 2: Average collection efficiency (%) varies between countries.⁵
The methodologies
The main methodologies that are currently available for use when implementing LFG projects are spread across three of the top Standards Bodies: the Clean Development Mechanism (CDM), the Climate Action Reserve (CAR) and the American Carbon Registry (ACR). Gold Standard (GS) and Verified Carbon Standard (VCS) generally use CDM methodologies (Table 2).

Table 2: Methodologies across Standard Bodies.⁶
Within these methodologies, ER calculations may use general models but the parameters within these models are likely to change. These models are often country or region specific and may be applied outside of the intended countries/regions. Where the models are based on location specific data, the use of a model in a different location could introduce uncertainties as the inputs will no longer be climate specific.
The most commonly used models are⁷:

Part 2 – Landfill characteristics
In this section, we look at landfill characteristics. We investigate the landfill lifecycle, as well as how methane oxidation, cover type and microclimate may affect LFG generation and recovery.
Landfills have a lifespan, just like humans do
As a first point of analysis, we looked into how LFG emissions change throughout a landfill’s lifetime and found that all landfills demonstrate a similar pattern. Figure 3 displays the typical LFG generation lifecycle that a landfill would undergo.
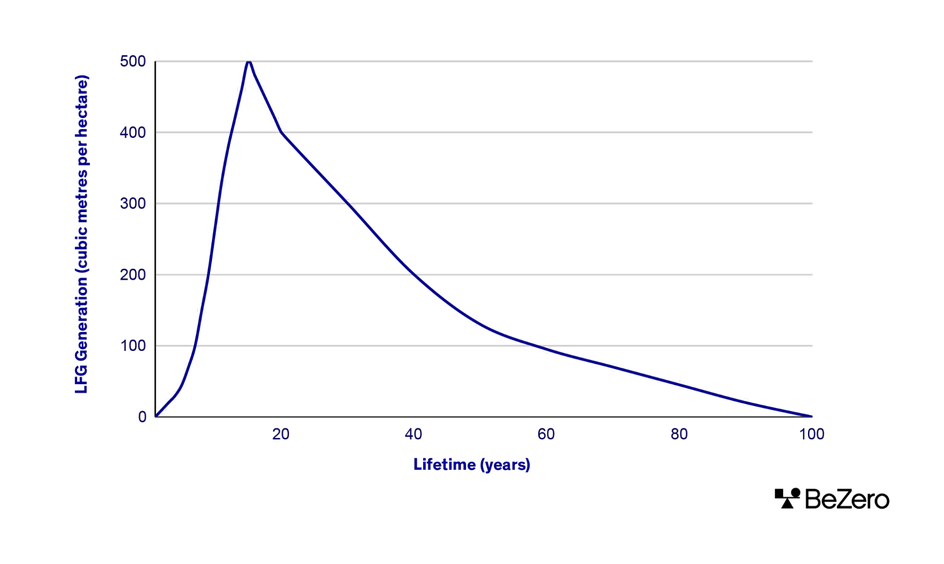
Figure 3: All landfills exhibit this general lifecycle⁴ where peak methane occurs right before landfill closure (~20 years) and gradually declines with landfill age.
A landfill is normally operational and collects waste for 15-20 years before reaching waste capacity and closing. As more waste accumulates over the operational lifecycle phase, more LFG gets generated. Hence, it is at the point of closure where the most amount of LFG is released. LFG cannot be captured until after the landfill is closed, or where landfills are split into sections (cells) and closed individually. After closure, the whole landfills or individual cells are capped with a soil or synthetic liner, as without a capping system, there is no method of trapping the gas for collection. A landfill may be in existence for over 100 years whilst the waste decays and continues to emit LFG.
What drives LFG disparity
Despite all landfills following this general pattern, the quantity of LFG generated and recovered is not always the same at every landfill. Waste composition is considered the largest driver of differences in LFG generation. Different waste types degrade at different speeds, and thus produce different quantities of LFG. Waste composition is normally calculated on a project specific basis within methodologies and thus is appropriately accounted for in ER’s. Whilst waste composition is arguably the largest driver, even if waste types are similar between landfills, differences in LFG generation and recovery can still exist.
For instance, a comparison of two sanitary landfills in the USA with similar waste composition display significantly different LFG generation rates (Figure 4). One might assume that multiple landfills in the same country with similar waste types would generate the same quantity of LFG. This is however not always the case.
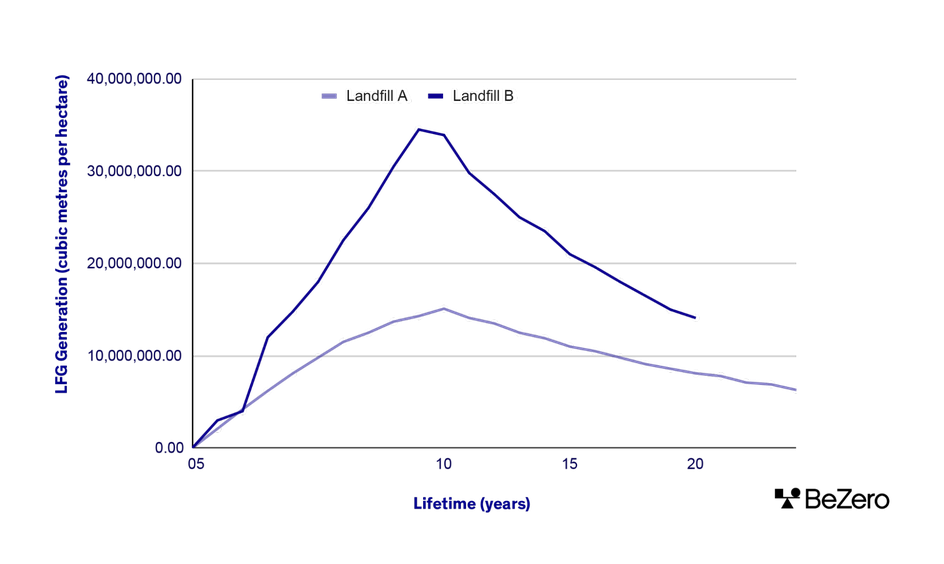
Figure 4: LFG generation rate differs between two sanitary landfills in the USA.⁸
To better understand this question, and help assess the carbon efficacy of LFG carbon projects, BeZero Carbon has collated a proprietary database using industry data and peer reviewed literature to investigate the differences in LFG generation and recovery between landfills and the influence of default values in ER calculations. The database consists of data from 90 landfills across 20 countries for methane oxidation, and 60 landfills across 40 countries for collection efficiency rates to investigate how LFG generation and recovery might differ geographically (Figure 5). The quantity of data collated is dependent on the abundance of available data in the public domain.
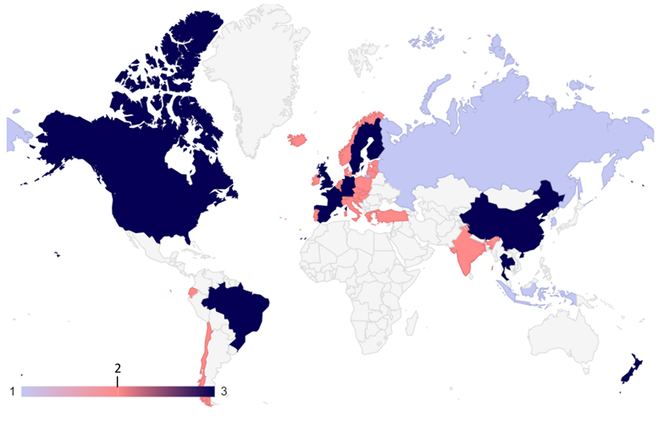
Figure 5: The distribution of LFG project data points collected by BeZero (1 = data points for methane oxidation; 2 = data points for collection efficiency; 3 = data points for both methane oxidation and collection efficiency).
Our internal BeZero dataset identified three main factors which may affect LFG generation and recovery rates in landfills. Default values are commonly applied to account for the below factors:
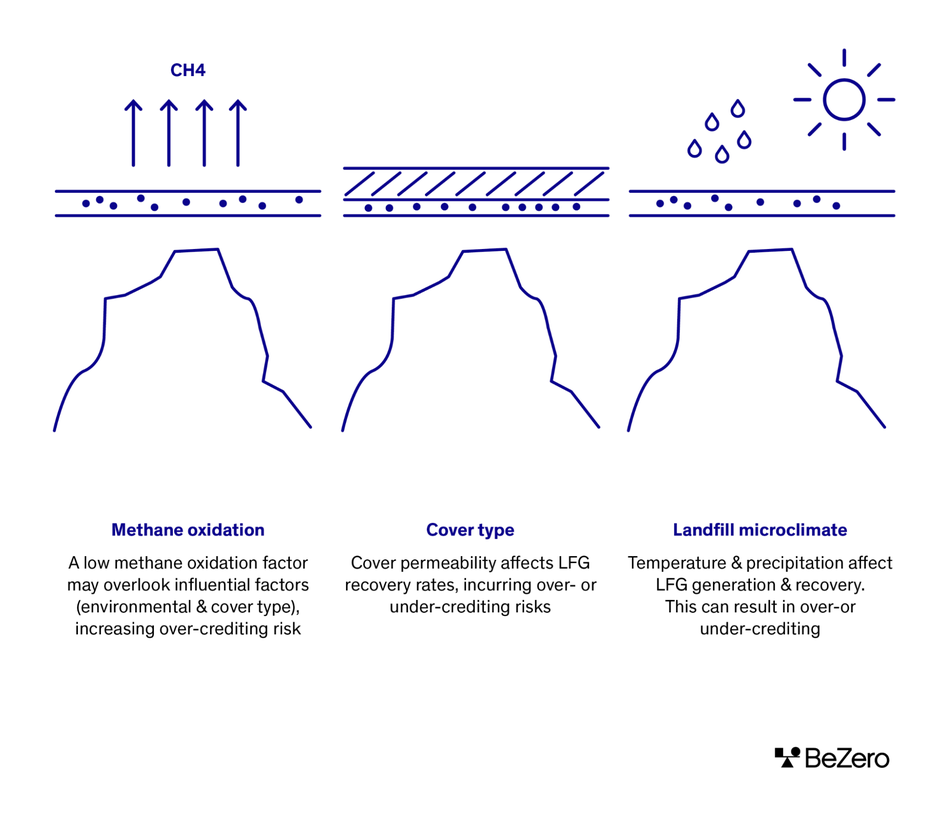
Methane oxidation
Put simply, methane oxidation is when the methane generated in waste disposal sites migrates upwards through soil cover layers and is oxidised by methanotrophic bacteria to CO₂ and water.⁹ Higher rates of methane oxidation reduces the volume of gas that can be collected from waste, so in theory LFG projects would want to minimise methane oxidation as much as possible in order to maximise LFG recovery and collection efficiency.¹⁰
An examination of 90 landfills across 20 countries finds average methane oxidation rates to be over double that of the current default.
Methane oxidation is tightly linked to cover type and landfill microclimate. Under the right conditions, methane oxidation could be minimised.
Cover type
The cover type used in landfills doesn’t necessarily affect LFG generation, but it does affect how much LFG can be recovered. This is because different cover types influence different rates of methane oxidation and as explained above, methane oxidation may reduce the amount of LFG available to be collected.
Our analysis found that soil covers, such as clay, sand and compost for example, often accompany higher methane oxidation rates compared to synthetic liners, such as high-density polyethylene membranes (Figure 6).
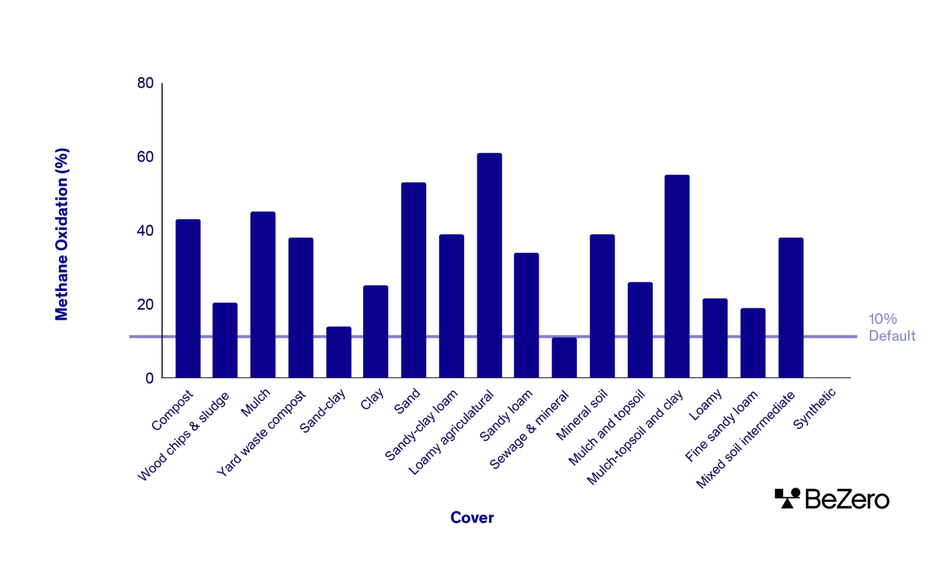
Figure 6: Methane oxidation rate across cover types is, in almost all cases, above the current 10% default, which may incur over-crediting risks depending on the selection of cover used.¹¹
The cause of this is that methanotrophic bacteria are absent within non-organic liners (synthetic). Oxygen penetration from the atmosphere is therefore minimal, and less methane is oxidised. For this reason, some methodologies recommend that a 0% methane oxidation factor is applied in ER calculations where a synthetic liner is used.
Methane oxidation rates are not uniform across soil cover types. More permeable soil covers, such as gravel and sand, accompany higher methane rates compared to more compacted soils, such as clay. More permeable soil types encourage a wealth of oxygen diffusion, activating methane oxidation within the layer itself.
Our assessment and rating of the 20 LFG projects within the BeZero Carbon Market (BCM) finds that the application of a 10% methane oxidation default value is common practice. However, our review of external peer-reviewed literature finds that methane oxidation rates across soil types are likely greater than the 10% default value. This questions whether one value should be used for all soil cover types when there is so much variation based on cover type alone.
Landfill microclimate
To further complicate things, like in most biological environments, environmental factors, such as temperature and precipitation, strongly influence biological processes. Landfills are no exception. Temperature, moisture content and oxygen availability influence methane oxidation as well as waste decay rates, which inherently influences the speed and quantity at which LFG is generated.
We analysed data from landfills all over the globe to investigate how a country’s climate and landfill microclimate might impact LFG generation, methane oxidation and LFG recovery. We find that methane oxidation and waste decay occur at an optimum under specific conditions. For example, temperatures between 20-30о C yield the highest rates of waste decay and methane oxidation,¹² and higher rates are also seen where moisture content is high within cover soils (>20%).¹³
For the most part, climate conditions are taken into account in ER calculations in the context of waste decay but are not necessarily considered in a methane oxidation context. However, our analysis has demonstrated that climate does influence oxidation. An example of this is clear in the USA where there are multiple different climates.
For instance, Missouri has a humid continental cool climate with methane oxidation rates commonly around 16% with a soil liner⁷. Comparatively, Florida has a humid subtropical climate with oxidation rates of over 20% with the same type of liner.¹⁴
Between countries, differences are even more significant. For example, Thailand with a tropical climate can have oxidation rates of around 20%,¹⁵ but Canada with a continental climate can have up to 55% oxidation.¹⁶ Methane oxidation rates across the globe are demonstrated in the figure below (Figure 7).
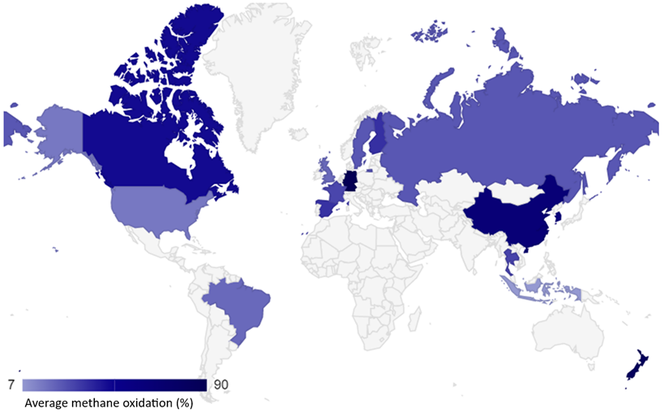
Figure 7: Average methane oxidation rates¹⁷ (%) across the globe.
Conclusion
We find that default values used for ER calculations, specifically default methane oxidation factors, may not accurately represent fluctuations in rates across cover types and climates and may largely ignore discrepancies in methane oxidation.
Many factors influence LFG generation and recovery, but based on our experience in rating 20 LFG projects as well external research across 90 landfills across the globe, we find methane oxidation to be one of the most influential factors impacting over-crediting. Of the 20 BeZero rated LFG projects, the choice of methane oxidation rate used in ER calculations is considered an important factor in our assessment of over-crediting.
We understand that treating all landfills as the same and relying on default values risks ignoring the disparities within the sector. To overcome this at BeZero, we incorporate our extensive and curated database into our ratings assessment to help understand whether the use of default values in ER calculations is accurately representative of LFG flux and recovery rates.
References
¹IPCC, 2023
⁵BeZero database collating multiple sources
⁶Methodology links: AMS-III.G, ACM0001, Landfill gas destruction and beneficial use, U.S Landfill Protocol, Mexico Landfill Protocol
⁷Model links: LandGEM, IPCC, TOOL04
¹¹BeZero database collating multiple sources
¹⁷BeZero database collating multiple sources