How economic SDG claims can be impactful in the VCM
Here are some key takeaways from the report
The economic SDG indicators are to some extent appropriate for use at the VCM project scale. As much as 9.5% of the indicators are scalable from national to project scale.
Lower Income Countries (LICs) have relatively low progress towards SDG 1 & 8. Therefore, the economic impacts made by carbon projects located in LICs have high potential for additionality.
The economic SDGs do not have a significant influence on carbon credit prices compared to other SDG claims. On average, credits with SDG 1 claims lead to a 25% premium compared to any other SDG claim. But, credits with SDG 8 and/or 12 claims have lower prices (0.8% lower, 8.5% lower).
Contents
- Economic SDG claims are becoming more popular
- SDG 1, 8 & 12 have a strong potential for representing economic impact
- Economic data availability is high but progress is slow in LICs
- Claiming economic SDGs is valuable to a limited extent
- Conclusion
- Appendix
Please note that the content of this insight may contain references to our previous sector classification system. You can find details of our updated system, effective since July 19th 2023, here.
Economic SDG claims are becoming more popular
The economic-focused UN sustainable development goals (SDGs), consist of SDG 1, 8 & 12 (‘No poverty’, ‘Decent Work and Economic Growth’, and ‘Responsible Consumption and Production’ respectively).
The COVID-19 pandemic and the Ukraine conflict were major setbacks to achieving the economic SDGs. From 2019-2020, the global poverty rate rose from 8.3% to 9.2%, the first annual increase since 1998.1 In addition, global gross domestic product (GDP) per capita decreased by 4.4% in 2020.2 This has slowed the global growth in the economic sector; however, the voluntary carbon market (VCM) could play a role in progress towards the economic SDGs.
VCM projects often have non-carbon impacts, including economic impacts, which they tend to express as SDG claims. The UN SDG framework is designed for country level use. Therefore applying the SDG framework in the VCM is challenging. This report on SDGs 1, 8 & 12 is the fourth in a series of reports on SDG claims in the VCM to explore the appropriateness of using the SDG framework in the VCM.
SDGs 1, 8, & 12 claims are becoming increasingly popular. From 2015 to 2023, the share of projects with SDG 1 and/or 8 claims approximately doubled (Figure 1). Projects with SDG 12 claims only slightly increased during the same period (3%). Furthermore, the share of issued credits claiming all three economic SDGs has increased over time (Figure 2).
Upward trend in the share of issued projects with SDG 1, 8 & 12 claims.
Figure 1: The trends of issued projects with at least SDG 1, 8 & 12 claimed out of total projects with claims, between 2015 and 2023.
Source: A BeZero dataset comprised of the four largest accreditors, Verra, Gold Standard (GS), American Carbon Registry (ACR), and Climate Action Reserve (CAR).
Share of issued credits with SDG 1, 8 & 12 claims increasing over time.
Figure 2: The trends of issued credits with at least SDG 1, 8 & 12 claimed out of total credits issued with claims, between 2015 and 2023.
Source: A BeZero dataset comprised of the four largest accreditors, Verra, Gold Standard (GS), American Carbon Registry (ACR), and Climate Action Reserve (CAR).
Economic SDG claims are particularly popular within the Energy and Household Devices sectors (Figure 3). Energy projects claim SDG 8 more commonly than other sectors. However, Household Devices projects tend to claim SDG 1 & 12 the most. Energy and Household Devices projects may claim the economic SDGs, as they tend to provide access to basic services, and generate forms of income and employment.3
Energy and Household Devices projects have issued the most credits with SDG 1, 8, and or 12 claims.
Figure 3: Issued projects with SDG 1, 8 or 12 claims by sector between 2015 and 2023.
Despite their popularity, the impacts behind the economic SDG claims are difficult to decipher. In this report, we address this gap in knowledge by analysing how well these claims represent economic impact in the VCM by their targets and indicators. All SDGs are composed of targets (sub-goals) and indicators (progress metrics). SDG 1 has seven targets and 13 indicators, SDG 8 has 12 targets and 16 indicators, SDG 12 has 11 targets and 13 indicators, see Appendix A
SDG 1, 8 & 12 have a strong potential for representing economic impact
We assess how well SDGs 1, 8, and 12 represent the economic impact of VCM projects in this report by:
The scalability of the indicators to the project scale
How well the indicators measure economic impact
Scalability of the economic SDG indicators to the project level:
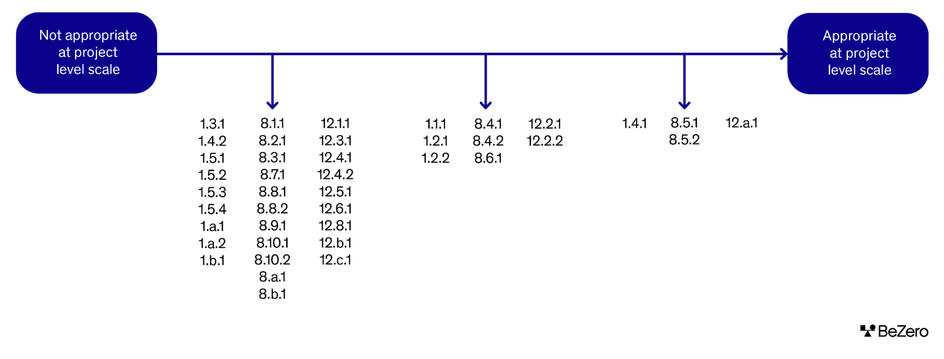
The UN indicators were originally designed for countries to measure their progress towards the SDGs. Thus, applying them at the project scale can be challenging. The majority of the economic SDG indicators are not applicable at the project scale. However, the economic SDGs have more indicators that are more scalable than SDG 13, for instance. For other SDGs we have assessed, SDGs 3 and 7 have a similar proportion of indicators that are scalable.
SDGs 1 and 8 have more scalable indicators than SDG 12, see Figure 4. For instance, SDG 8.5.1 specifically measures an average hourly earning, which can be applicable to projects that improve local incomes.
Figure 4: The majority of SDG 1, 8 and 12 indicators are not appropriate for use at the project scale.
Measurement of economic impact by the SDGs:
The majority, 38%, of SDG 1, 8, and 12 indicators are strong measures of economic impacts. SDG 8 has the highest proportion of strong indicators. Only one indicator, 8.a.1 - ‘Aid for trade commitments and disbursements’ - doesn’t clearly measure economic impact.
The low-range indicators that are not appropriate at project scale measure the progression of national policy rather than directly measuring economic progress. An example of a policy indicator is 1.3.1 (‘Implement nationally appropriate social protection systems and measures for all, including floors, and by 2030 achieve substantial coverage of the poor and the vulnerable’). Due to unquantifiable metrics, not all individual indicators are suitable for representing the impacts of a VCM project.
The weakest indicators lack explicit quantifiable metrics of economic impact.4 For instance, SDG 1 provides only one measure of poverty, 1.1.1, ‘people living on less than $1.25 a day’, which does not include aspects of poverty such as child labour, or lack of access to safe drinking water, shelter and sanitation.5
Figure 5: Categorisation of SDG 1, 8 and 12 indicators in relation to measuring economic impacts

Note: We categorised the type of relationship between SDG 1, 8, and 12 indicators and economic impact based on our own literature review, the UN official indicator methodologies, and stated limitations published in UN metadata documents. This categorisation should not be interpreted as fact or a ranking of the indicators and is not affiliated with BeZero carbon credit ratings.
Although the majority of the economic SDG indicators measure economic impact well, they often have missing data. Data availability relies heavily on country reporting, rather than the strength of the indicator itself.
Economic data availability is high but progress is slow in LICs
An average of 59% of country indicator data for SDGs 1, 8, and 12 has been reported since 2015 to 2021. However, the amount of data reported varies widely by economic status groups.
Country-level data availability for the economic SDGs
The majority of the SDG 1, 8, and 12 data is reported by lower-middle and low-income countries (LMICs), see Figure 6. When compared to the high income groups, on average LICs report 8% more data for SDG 1, 0.4% more data for SDG 8, and 5.3% more data for SDG 12. Due to their higher data availability, it is easier to understand the impact of economic SDG claims made by projects located in LMICs.
The highest percentage of reported indicators out of all possible reports were made by lower-middle income countries for SDGs 1 and 8 and majority of SDG 12.
Figure 6: Proportion of reported a) SDG 1, b) 8 & c) 12 indicators by countries classified by income groups, between 2015 and 2021.
Source: UN SDG Global Database
Slow progress towards the economic SDGs in LICs
There is relatively less progress towards the economic SDGs by LICs.6 LICs report more data on the economic SDGs but that doesn’t mean they are achieving them, only that we have more data on their state of progress. LICs have not yet made a quarter of the progress needed to achieve SDG 1 and just over the half of progress for SDG 8. However, LICs are on track for achieving SDG 12.7 As LICs have made the least progress towards achieving SDGs 1 and 8, VCM economic SDG contributions are likely more impactful in LICs.
Additionally, LICs also have some of the highest data availability for SDGs 1, 8, and 12. Thus, economic SDG claims are likely more impactful in LICs and easier to contextualise.
Although VCM economic SDG contributions can be highly impactful, they have minimal positive influence on credit price.
Claiming economic SDGs is valuable to a limited extent
Projects that make economic SDG claims have a price premium of 27.4% compared to credits without SDG claims. This is not surprising, as credits with any SDG claims have price premiums.
However, when comparing credits with economic SDG claims to credits with any claims, it’s a different story. Credits with SDG 1 claims fetch a price premium of 25% compared to any SDG claims. However, the other economic SDG claims don’t have premiums. On average, credits with SDG 8 claims actually cost 0.8% less and credits with SDG 12 cost 8.5% less than credits with any SDG claims.
Household Devices
Here we dive deeper into price within the sector that most commonly claims SDGs 1, 8, and 12, the Household Devices sector (Figure 7). Within the household devices sector, SDG 1 and 8 claims have price premiums of 5.2% and 15.2%, respectively, compared to any other SDG claim. However, any other SDG claims compared to SDG 12 claims have a price premium of approximately 14.9%.
SDG 1, 8, and 12 claims do not fetch higher prices within the household devices sector over other SDG claims
Figure 7: Weighted average price of household devices carbon credits issued by SDG claim status. The data is from January 2022 to June 2023.
Source: A BeZero dataset comprised of the four largest accreditors, Verra, Gold Standard (GS), American Carbon Registry (ACR), and Climate Action Reserve (CAR) and pricing data from Xpansiv’s CBL markets.
In general, credits with SDG 1, 8, and 12 claims do not have significant impacts on carbon credit price compared to credits with other SDG claims. However, within the Household Devices sector, credits with SDG 1 and/or 8 claims fetch higher prices than those with other SDG claims.
Conclusion
SDGs 1, 8, and 12 are commonly claimed by VCM projects, especially by Energy and Household Devices projects. However, there is little understanding about how well these claims truly represent economic impact.
SDGs 1 and 8 are best suited to represent impact in the VCM, as they have a higher number of indicators that can be scaled down to a project level. SDG 12 is suitable to a more limited extent. Nevertheless, SDGs 1, 8, and 12 all have strong potential to reflect economic impact.
LICs have some of the best availability of data on progress towards economic SDGs, and have the least amount of progress towards achieving the economic SDGs. Thus, VCM SDG 1, 8, and 12 contributions are easier to accurately contextualise and may be the most impactful in LICs.
Following our analysis, below are several recommendations for VCM stakeholders when considering carbon credits with SDG 1, 8, and 12 claims:
Consider the host country’s SDG 1, 8, and 12 data availability. SDG 1, 8, and 12 claims are easier to contextualise in countries with more data, which will tend to be LMICs.
Review the income status of project host countries when assessing the additionality of SDG 1, 8, and 12 impacts. The additionality of the impacts may depend on the host country's progress towards the SDGs.
When seeking projects which make economic impacts, identify how well the indicators the project used measure economic impacts.
Note the project sector may influence the extent of the price premium that SDG 1, 8, and 12 claims fetch. In general, the economic SDGs do not have strong impacts on carbon credit price compared to other claims, but they do within the household devices sector.
Increasing the transparency of SDG claims is essential for understanding the integrity of SDG claims, including economic SDG claims. Look out for other insights from BeZero Carbon on more SDG claims.
Appendix
Table 1: SDG 1 End poverty in all its forms everywhere: Targets and indicators summary.
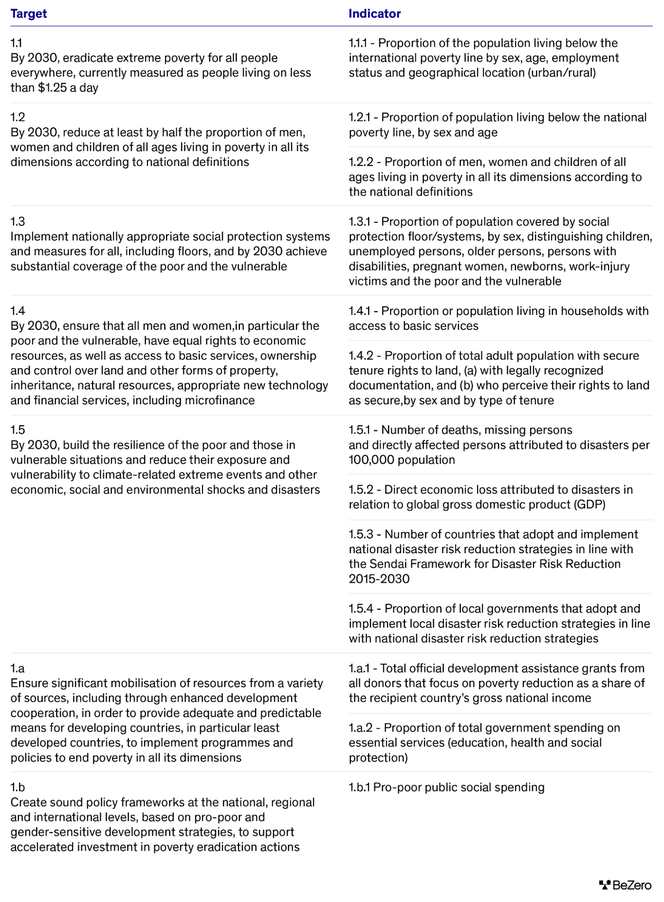
Table 2: SDG 8 Promote sustained, inclusive and sustainable economic growth, full and productive employment and decent work for all: Targets and indicators summary
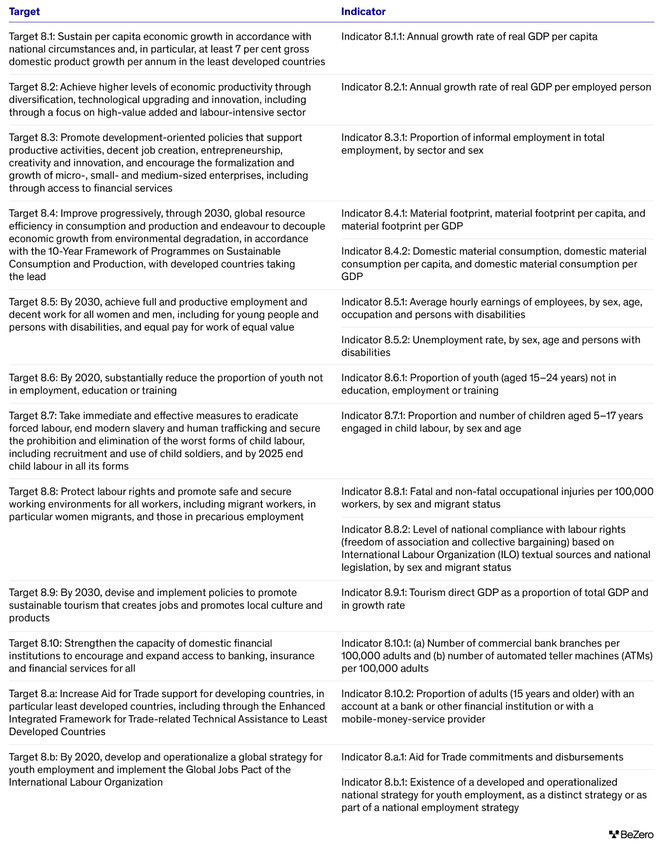
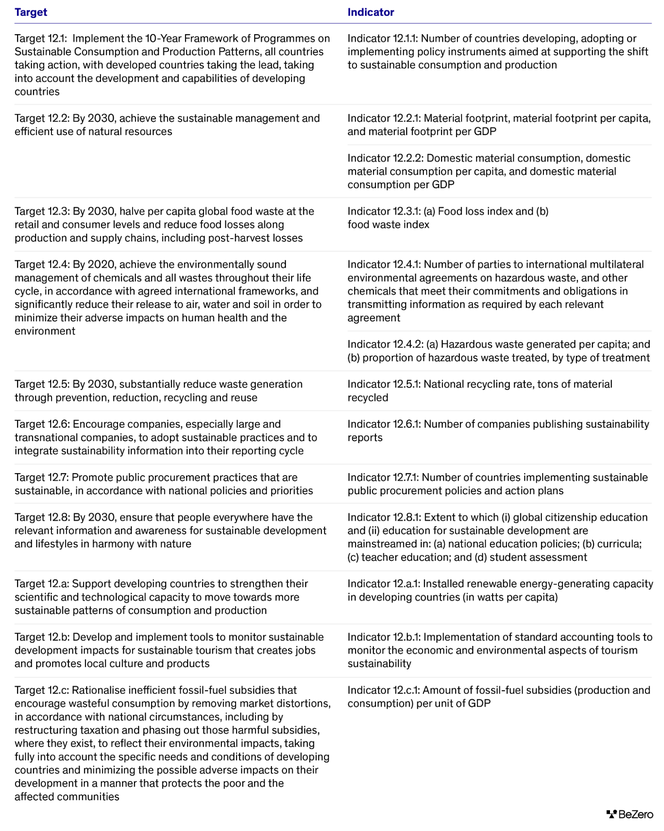
Table 3: SDG 12 Promote sustained, inclusive and sustainable economic growth, full and productive employment and decent work for all: Targets and indicators summary
Sources and References
1 United Nations., (n.d). ‘The Sustainable Development Goals Report 2022’. Available at: The-Sustainable-Development-Goals-Report-2022.pdf (un.org)
2 United Nations., (n.d), ‘Goal 8’. Available at: Goal 8 | Department of Economic and Social Affairs (un.org)
3 Wissner, N., Schneider, L., Jung, H., Orozco, E.H., Kwamboka, E., Johnson, F.X. and Bößner, S.,(2022). Sustainable development impacts of selected project types in the voluntary carbon market. Available at: https://shorturl.at/hjNQR
4 Janoušková, S., Hák, T. and Moldan, B., (2018) ‘Global SDGs assessments: Helping or confusing indicators?. Sustainability, 10(5), p.1540’. Available at: Global SDGs Assessments: Helping or Confusing Indicators? (semanticscholar.org)
5 Sengupta, M., (2018). Transformational change or tenuous wish list?: A critique of SDG 1 ('End poverty in all its forms everywhere'). Social Alternatives, 37(1), pp.12-17. Available at: https://www.mcgill.ca/roled/files/roled/2018-ramanujam-soc_alt_vol_37_1_small2.pdf#page=12
6 Lafortune, G., Fuller, G., Bermont Diaz, L., Kloke-Lesch, A., Koundouri, P., Riccaboni, A. (2022). Achieving the SDGs: Europe’s Compass in a Multipolar World. Europe Sustainable Development Report 2022. SDSN and SDSN Europe. France: Paris. Available at: https://s3.amazonaws.com/sustainabledevelopment.report/2022/europe-sustainable-development-report-2022.pdf
7 Sachs, J.D., Lafortune, G., Fuller, G., Drumm, E. (2023). Implementing the SDG Stimulus. Sustainable Development Report 2023. Paris: SDSN, Dublin: Dublin University Press, 2023. 10.25546/102924. Available at: https://s3.amazonaws.com/sustainabledevelopment.report/2023/2023-sustainable-development-report.pdf