
Five new ways to look at the Voluntary Carbon Market
Here are some key takeaways
Our new Markets & Policy Insights research product uses ratings and other data to analyse carbon markets. It will be available on the BeZero Carbon Markets platform.
We start by looking back at 2022. Our analysis shows a budding relationship between ratings and price.
Our highest rated credits, representing a high likelihood of carbon avoided or removed, represent only 14.2% of the credits rated by BeZero, and this share has decreased in the last 12 months
Contents
- Introduction
- 1. Revealing quality in carbon markets
- 2. Using ratings for price discovery
- 3. Understanding what is driving supply of credits in the VCM
- 4. Analysing the drivers of demand for credits
- 5. Analysing risk across sectors and credit types
- Conclusion
Please note that the content of this insight may contain references to our previous rating scale and associated rating definitions. You can find details of our updated rating scale, effective since March 13th 2023, here.
Introduction
In 2023 BeZero Carbon will be producing a new Markets & Policy Insights research product which will be available on the BeZero Carbon Markets platform. Markets & Policy Insights will produce research on carbon market activity and regulatory developments in the Voluntary Carbon Market (VCM), drawing on our proprietary ratings data.
2022 was the year that ratings were officially adopted by the Voluntary Carbon Market. We launched the BeZero Carbon Rating (BCR) in April 2022 and it has now become a cornerstone of market analysis. To date BeZero Carbon has rated 285 projects, capturing 49% of market liquidity, giving us the broadest coverage in the market.
This gives us a powerful tool - and a vast amount of new data - to analyse carbon market activity. BeZero Markets & Policy Insights will use this data to better understand the evolution of carbon markets.
In a teaser of our new product, here are five ways BeZero Markets and Policy Insights will be using this new data.
1. Revealing quality in carbon markets
This is a crucial moment for carbon markets. As our CEO Tommy Ricketts said recently, for the market to grow sustainably and rid itself of the “wild west” label, it needs to better understand the quality of credits in the market. All market actors - from buyers to brokers, regulators and investors - need a tool to help them.
This is where carbon ratings come in. Our risk information allows us to look at carbon credits in a new way, shining a spotlight on relative quality in the market. Never has this information been as important as it is now.
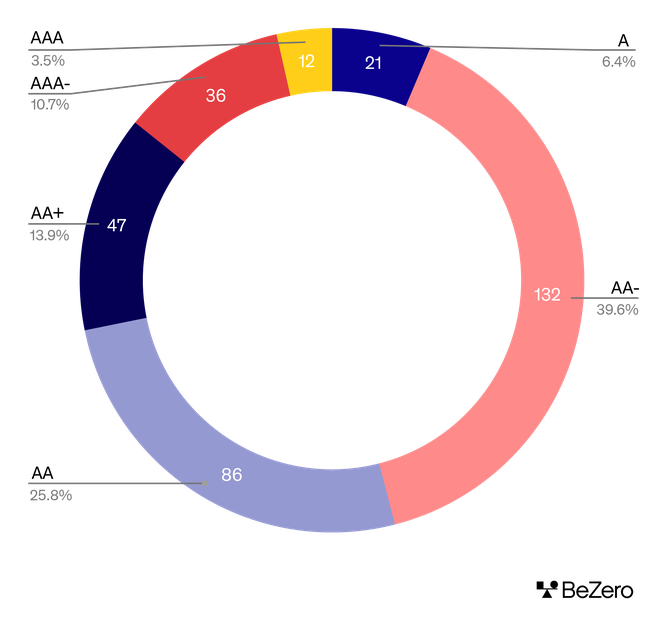
Total outstanding credits per rating (millions).
Each carbon credit should represent a tonne of carbon avoided or removed, but as our data shows credits vary significantly in their carbon efficacy. Of the projects rated by BeZero Carbon, only 14.2% of credits have a rating of AAA- or higher, representing a high likelihood of avoiding or removing carbon. In 2022 the supply of high quality credits became more scarce, reducing by more than 40% as a share of total issuances. Our new insights product examines credit quality at the regional, sectoral and project level and also explores how the availability of high quality credits is changing over time.
2. Using ratings for price discovery
The goal of ratings data is to arm market participants with risk information, giving them a new and valuable input into price discovery and helping to make the market more efficient.
Increasingly, we are seeing market infrastructure adopting our ratings. Xpansiv CBL, the largest carbon exchange, includes BeZero Carbon Ratings in their end of day pricing report. Multiple other marketplaces integrate our ratings on their platform. Ratings is now a key feature of data aggregators such as Allied Offsets and Viridios. And market publications, such as Carbon Pulse closely watch our ratings news.
A preliminary analysis of the price-ratings relationship helps to understand this level of interest. While it is very early days, we find some signs of a budding relationship. Using transaction data provided by Xpansiv, from its CBL market, our analysis incorporated actual trading prices from data representing over 10 million tonnes worth of transactions since April 2022. This analysis suggests that higher BeZero Carbon ratings may be associated with higher prices overall.
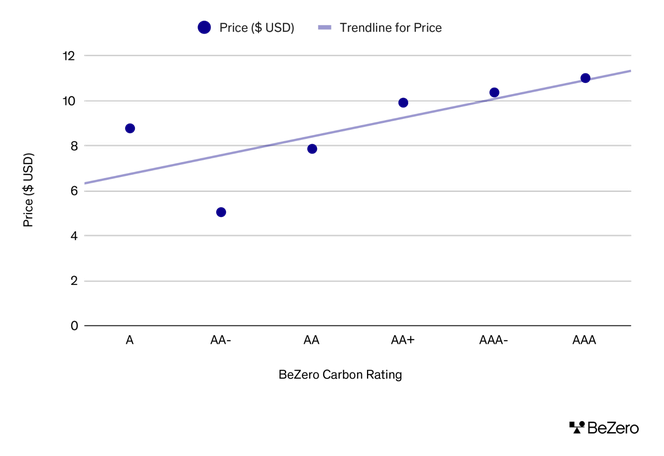
Price and rating relationship (April - December 2022).
Note: Analysis uses transacted price data from Xpansiv CBL market.
The market is in its infancy and the correlation is far from perfect (the R^2 is 26% when we use each individual rated transaction) but this information shows the potential power of ratings for price discovery in the market.
Looking more deeply at what drives this correlation will also be a focus for future research. In another preliminary analysis we explore when this relationship is strongest. Looking at market liquidity data is revealing, showing a stronger correlation when liquidity is high, and little or no relationship when there is low trading activity in the market.
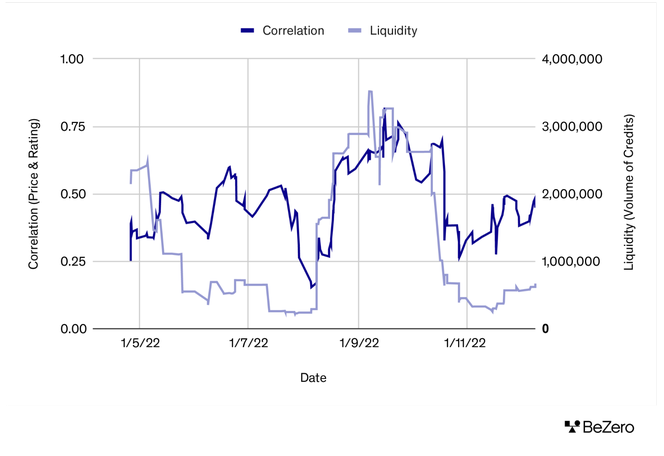
Price-ratings correlation and liquidity (April - December 2022).
Note: Analysis uses transacted price data from Xpansiv CBL market.
Here market liquidity is proxied by a rolling 30 day sum of transacted volume, of projects rated by BeZero Carbon, on the CBL platform. As liquidity grows, so does price discovery, which leads to more efficient pricing.
While this highlights how challenging market conditions were in the last quarter, it paints an optimistic picture for the market if it can continue to attract more participants and more volumes.
3. Understanding what is driving supply of credits in the VCM
To meet government and corporate carbon targets, the supply of carbon credits is expected to increase rapidly in the coming months and years. Yet in 2022, the supply of credits declined by more than one fifth (21%).
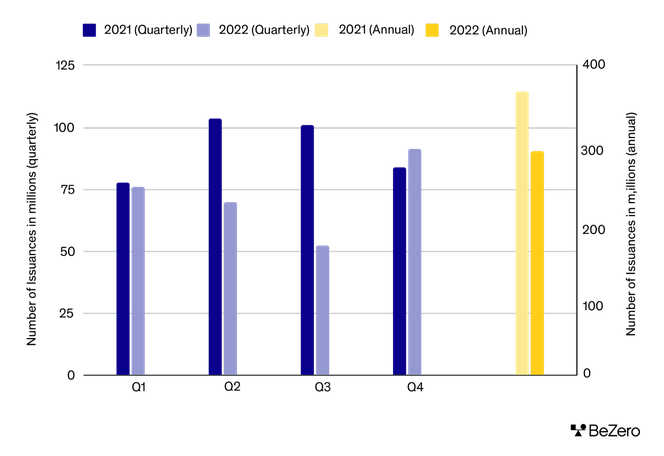
Number of issuances per quarter (2021 vs 2022).
The drivers of supply in the VCM are complex - regulation can play a key role, but other factors, such as accreditation delays and market expectations can be important. Examining these changes using ratings data provides new insights into what are the true drivers of supply and which segments of the market they are impacting most.
4. Analysing the drivers of demand for credits
Our data can also be a powerful tool to understand demand patterns in the VCM. While overall retirements remained relatively stable in 2022, this masks significant variation across different sectors, some of which saw significant increases.
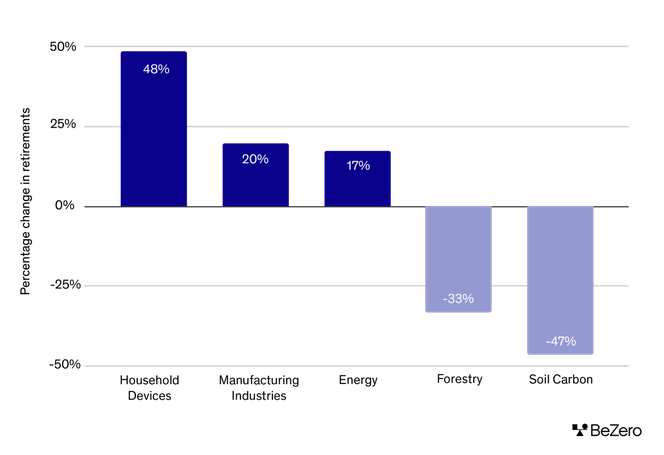
Percentage change in retirements in 2022 for the largest sectors.
Regulatory factors that restricted supply may have been a key factor in the declining demand of nature based credits. The largest increase by sector was seen in the Household Devices sector group, which increased by 48%.
Ratings analysis shows this is having interesting impacts. The average rating for this sector is AA-. Increased demand for lower rated projects is a trend seen across the market in 2022.
5. Analysing risk across sectors and credit types
As the market develops, different types of carbon credits are proliferating the market. Our analysis shows that different types of credits vary significantly in the typical rating awarded.
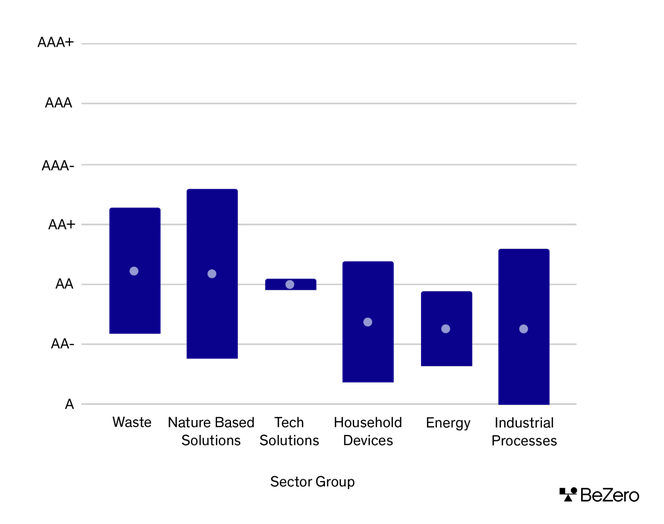
Average rating of project sector groups (light blue) with standard deviation (dark blue)
The chart above shows the average rating and range (looked at in a standard deviation) by sector group. At a sector and sub-sector level this analysis is even more revealing, giving valuable insights in risk distribution across the market.
Conclusion
This is only the tip of the iceberg. Ratings are a relatively new tool for carbon markets and there is a vast amount of BeZero Carbon information that we are just beginning to explore.
If you are interested in learning more about the Markets & Policy Insight product, get in touch.