Building bespoke datasets to rate renewable projects
Here are some key takeaways from the report
BeZero Carbon have built bespoke databases and scenario analyses that effectively evaluate the role of carbon finance in renewable energy projects across the Voluntary Carbon Market.
Our analysis of these datasets indicates that, for most projects, the revenue generated from electricity sales significantly outweighs the revenue from carbon finance across three separate price scenarios.
The share of carbon finance relative to a project's overall revenue significantly impacts our additionality assessment.
Contents
- What Do Renewable Energy Projects Do?
- Building Bespoke Databases
- Feed-In Tariffs Under the Lens of Additionality
- Sources:
What Do Renewable Energy Projects Do?
Renewable energy projects generate greenhouse gas avoidance credits because they support the deployment of renewable energy projects using technologies such as wind, solar, hydropower, biomass, and geothermal. By generating electricity from renewable sources, these projects displace the electricity that would have otherwise been generated by the operation of grid-connected fossil fuel power plants.
Building Bespoke Databases
BeZero Carbon has rated a total of 102 renewable energy projects across 18 countries (as of 11th May 2023). To effectively evaluate the role of carbon finance for these projects, BeZero has built several databases that improve our ability to assess the financial additionality of individual projects. For each project, our financial scenario analysis will interrogate and compare the two main project revenue streams:
The estimated revenue generated from the sale of electricity to the power grid
The estimated revenue generated from the sale of carbon credits
To facilitate this analysis, BeZero Carbon has collated several proprietary databases, which are described in detail below.
1. Project Information Database
The most fundamental input to this model is the project-specific information extracted by our in-house data team from publicly-available project documents. The typical information collected as part of our analysis includes the following:
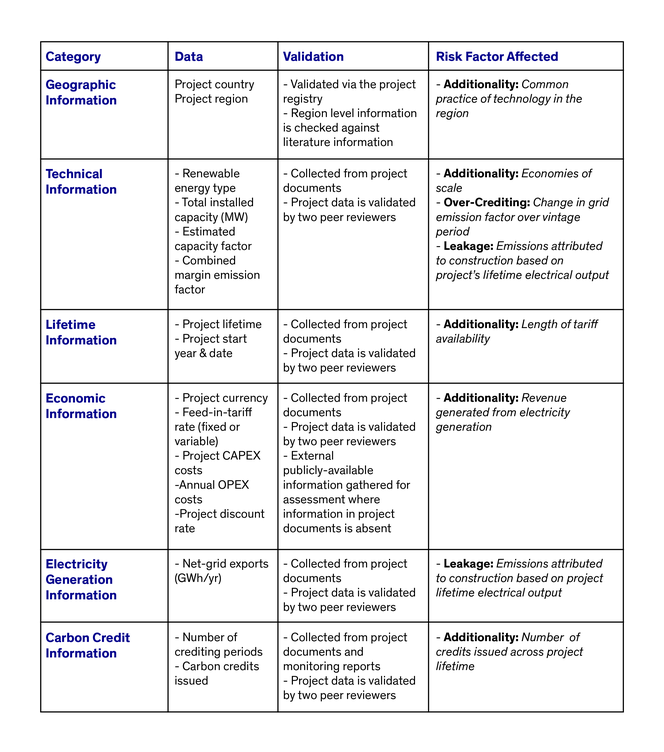
This information is collected for each project that meets our rating eligibility criteria. Additionally, we have established specific criteria that each project must meet in order for us to perform our assessment of the revenue breakdown.
2. Tariff Database
BeZero Carbon’s electricity tariff database contains data from peer-reviewed academic literature and industry benchmarks, providing estimated tariff values for all renewable technologies covered by our ratings, spanning a total of 29 countries, with the highest concentration of rated projects in China, India and Turkey (Figure 1). Using this information, BeZero can determine the typical rate at which a given renewable project can expect to sell electricity. This rate depends on the technology type, the tariff type, the project region, project country, operational start year and the lifetime of the project.
For example, in China, there is a government-backed feed-in tariff (FIT) mechanism which allows renewable energy operators to sell their electricity over the lifetime of the project at a guaranteed rate. The same mechanism has been used in India at both the national and regional levels. It is also common for projects to sell electricity through a Power Purchase Agreement (PPA), a similar mechanism through which energy is sold through a private contract, rather than as a result of a government mandate.
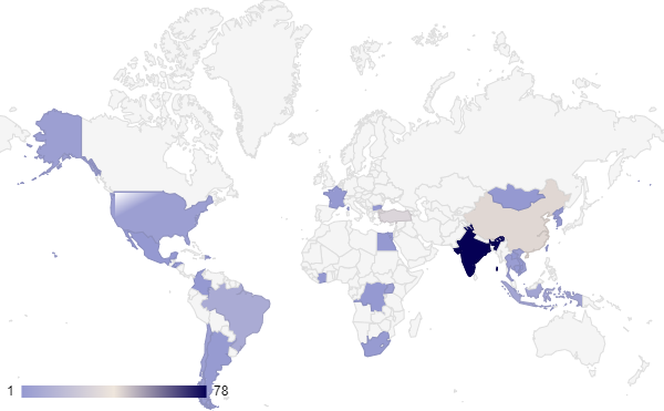
Figure 1: Span of the Tariff database
Initially, our database will only be used to assess projects where the FIT data is provided in project documents. Where that information is provided, we will conduct a scenario analysis and compare project values against those approximated using industry benchmarks. Once we have conducted enough assessments to be confident drawing conclusions for projects that do not provide FIT data, this will be rolled out across all renewable projects on our platform.
3. Historic Carbon Credit Price
BeZero Carbon’s historic credit price database details the estimated nominal cost of carbon credits from renewable energy projects operating in the VCM between 2000 and 2050. We have separated the estimates into three possible carbon price scenarios: low, average and high.
This database provides an extra layer of sensitivity to the calculations that inform our scenario analyses. By comparing the historical offset prices across three separate scenarios, we can evaluate variations in market credit prices to identify the share of a project’s revenue that is likely to have come from carbon finance. This informs one aspect of our additionality assessment.
4. Currency & Discounting
BeZero Carbon has compiled a currency database using the International Monetary Fund (IMF) as the principal data source. The scenario analysis is conducted in US dollars ($), whereas the electricity tariff data is often expressed in its local currency. Future currency conversions were estimated by finding the Compound Annual Growth Rate (CAGR) over a 10-year period and extrapolated from the most recent annual value available.
BeZero Carbon has also built a discounting database using data provided in industry literature. Renewable energy projects typically have a lifespan ranging from 15 to 50 years. In order to determine the present value of future cash flows, a discount rate must be applied. This allows for a more direct comparison between the different components that make up the overall project economics.
Feed-In Tariffs Under the Lens of Additionality
Additionality is the risk that a credit purchased and retired does not lead to a tonne of CO₂e being avoided or sequestered that would not have otherwise happened. This is of particular concern when rating renewable projects as, in many cases, renewable projects sell the generated electricity to the grid through tariff schemes, such as Feed-In Tariffs (FITs).
An FIT is a renewable energy policy that obliges energy suppliers to purchase electricity generated from renewable sources at a fixed price over a certain time period.1 Electricity rate design - the framework used by utilities and regulators to set prices for the provision of electricity services2 - is a notoriously complicated topic, particularly when taking into account the wide variety of tariff structures, market economics, and political regulations and incentives that exist across all renewable projects within the Voluntary Carbon Market (VCM).
This creates a potential additionality risk when assessing the efficacy of a carbon credit, as favourable FIT rates could allow a project to generate revenue independent of carbon finance. In order to inform our additionality assessment, BeZero Carbon has developed a proprietary scenario analysis tool to interrogate the two main revenue streams available to a renewable energy project. Below is a process flow diagram illustrating the steps involved in developing the revenue assessment before a rating is published on our platform.
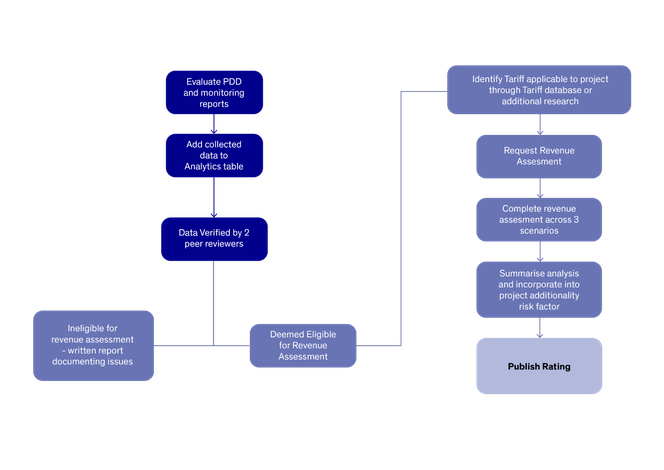
Figure 2: BeZero Carbon process for conducting revenue assessment
Output
The output of these financial scenario analysis assessments is included in the ratings breakdown for renewable energy projects rated by BeZero Carbon, given the project has provided sufficient information to conduct the analysis. Below is an example of our analysis for VCS 1188, a Chinese on-shore wind project with an installed capacity of 49.3 MW.
For this analysis, we approximated the project revenues using the following inputs: the project’s reported FIT, annual electricity output, grid emission factor, and value of carbon credits for the Renewables sub-sector from the Voluntary Carbon Market based on data from market carbon credit prices for 2017-2021.
Beyond the carbon credit values observed for this sub-sector, we extend our analysis to two scenarios that assess the role of carbon finance under a +/- 50% variation in carbon credit price. Our scenario analysis found that, for any given year in which this project issued carbon credits, the additional revenue stream generated from carbon finance would represent approximately 0.8% to 2.4% of total revenues.
The results of this analysis agree with our broader top-down and bottom-up view that carbon finance plays a relatively minor role in a renewable energy projects’ revenue compared to that from electricity sales. This substantiates our view that VCS 1188 faces significant additionality risk.
Figure 3: Approximated Project Revenue Breakdown
Sources:
2 (RAP online, 2023)