BeZero Carbon’s next generation of dynamic baselines
Dr Aoibheann Brady, Senior Geostatistical Scientist at BeZero, introduces how we use statistically matched dynamic baselines to overcome the challenges of assessing counterfactual baseline scenarios.
Statistical matching uses remote sensing and other geospatial data to pair map pixels in the project area with control pixels in the wider landscape. The rationale is that paired pixels should be similar in all relevant respects, except for carbon finance - analogous to case-controls in a clinical drug trial.
We use satellite monitoring to dynamically track and compare carbon emissions in the matched pairs through time. This informs the risk of over-crediting, specifically where this risk is driven by the project’s baseline assumption, against which carbon credits are issued.
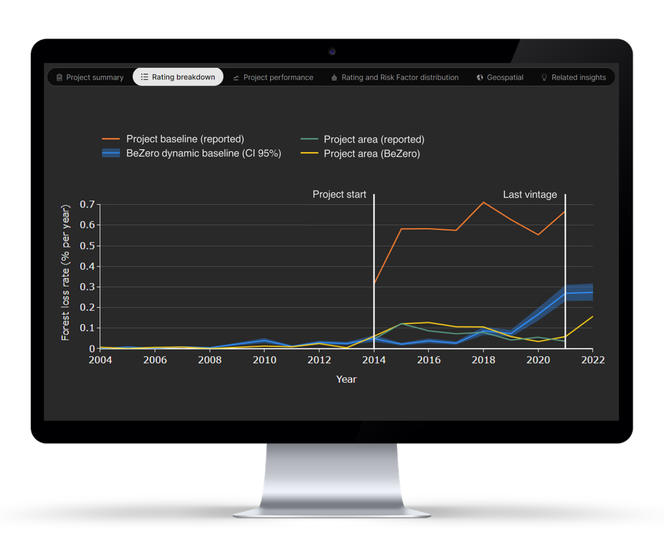
Example of BeZero’s dynamic baseline, compared with project reporting. BeZero monitoring aligns with project reporting of forest loss rates within the project area (green versus yellow lines). However, the project’s applied baseline (orange) is substantially higher than BeZero’s dynamic baseline (blue). Considered alongside other factors, such as the exclusion of forest degradation from carbon accounting, this implies significant risk of over-crediting. Interactive dynamic baseline charts are an upcoming feature on the BeZero Carbon Markets platform.
We use a two step matching procedure: (1) land stratification, matching lands by ownership, protection status, concessions and indigenous reserves, restricted by distance, and excluding other carbon projects in the landscape; and (2) statistical matching within strata, pairing pixels according to all other control variables relevant to the project, such as accessibility by road or river, and distance to recent deforestation. There is no perfect set of control pixels, however, so we repeat the matching process many times in a bootstrapping framework to quantify uncertainty.
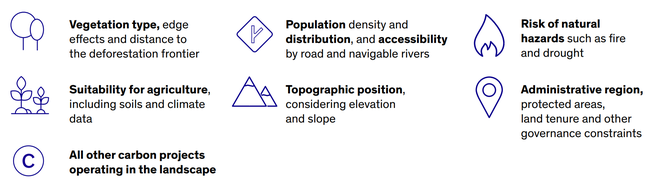
Examples of control variables used in the matching process. These are spatially calibrated for the specific project context, with machine learning used to assess their relative importance prior to statistical matching.
Our previous generation of baseline assessment was similarly dynamic. For every AUD project on our platform, we have assessed changes in the project’s reference region (where applicable) and in buffer zones around the project area over time, accounting for administrative units, other carbon projects, conservation areas and human pressures.
The major development in this next generation of dynamic baselines lies in the sophistication of how we constrain and select control pixels, and how we determine confidence intervals around our results. We build on statistical frameworks pioneered in the medical sciences, scaling these for application to big spatial data (tens of millions of pixels), and combining them with machine learning and expert knowledge, to rigorously assess baseline assumptions project by project.
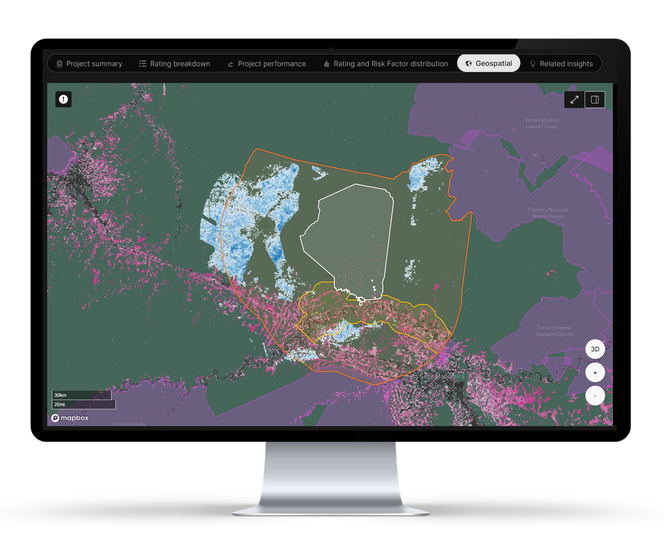
Example of BeZero’s statistically matched control pixels. The deeper the shade of blue, the more likely the pixels are to be a good match to the project area (white outline). The project’s own reference region is mapped in orange, and its leakage belt in yellow. Protected areas are in purple, and forest loss since 2000 is mapped in pink. Interactive dynamic baseline visualisations are an upcoming feature on the BeZero Carbon Markets platform.
Important aspects of our new dynamic baselines product, compared with other third-party assessments include: (1) careful consideration and parameterisation of factors relevant for deforestation at the project level, determined through extensive review of project documents, wider literature, and machine learning; (2) BeZero’s proprietary algorithms for statistical matching and quantification of uncertainty; and, crucially (3) nuanced, analyst-led interpretation of outputs and the weight that we give these in our risk-based analysis of carbon credit quality.
Hear from Dr Phil Platts, Director of Geospatial & Earth Observation, to learn how our geospatial analysis informs ratings, or contact commercial@bezerocarbon.com if you want to learn more about our geospatial research and platform tools.