A watched pot never boils: monitoring usage of cookstoves
Contents
- Introduction
- Cookstove carbon accounting
- Cookstove usage is inherently linked to crediting risk
- Methodology requirements for monitoring usage
- How sample size is determined
- Characteristics of the sample population
- Survey techniques
- Human error and bias
- Conclusion
Introduction
Cookstove projects make up a relatively small but rapidly growing part of the voluntary carbon market (VCM). While these projects are attractive to buyers for many reasons, including the associated co-benefits and impacts on sustainable development, concerns surrounding the carbon accounting of such projects have raised doubts about the quality of issued credits.
There are several components related to cookstove projects that introduce over-crediting risk, which we have explored in previous reports. Notably, past research has focused on the fraction of non-renewable biomass (fNRB), as this variable introduces the most uncertainty to cookstove emission reduction calculations. Secondary to fNRB, the reported usage and stove stacking rates applied by projects and the monitoring techniques used to determine these values can greatly influence net emission reductions.
Our analysis in this report focuses specifically on monitoring techniques to determine usage rates. As improved cookstove (ICS) projects generate emission reductions by reducing or replacing the consumption of greenhouse gas-intensive fuels used for cooking and heating, it is essential that baseline practices are displaced and that end-users adopt and maintain use of the new technology in order for these emission reductions to be effective.
In this report, we will explore how projects currently design and implement monitoring for cookstove usage, and the associated over-crediting risk. We will dive deeper into the assumptions underlying sample size calculations, the variations in population characteristics, different survey techniques, and the timing of surveys. These aspects inherently influence stakeholder responses. Finally, we will explore developments in cookstove monitoring, such as the rise of stove-use monitors, and how these may help to reduce uncertainties in monitoring.
Cookstove carbon accounting
Emission reductions are derived from fuel savings or switches under the project technology. Within these calculations, projects must make certain assumptions including determining the fraction of non-renewable biomass (fNRB), the usage rate or number of stoves in operation, and the quantity of the baseline fuel that is saved. In its simplest form, emission reductions are calculated using some combination of the variables listed in Table 1.
Table 1. Overview of key inputs in emission reduction calculations by cookstove projects. The degree of certainty is based on BeZero’s assessment of inputs, informed by peer-reviewed literature.
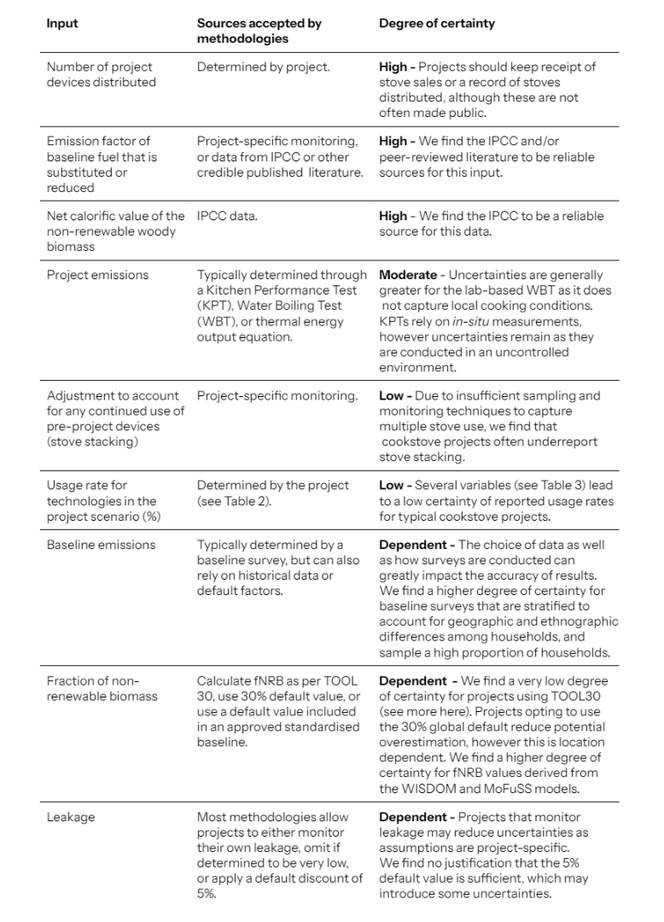
Given the above, we can see that there are several sources of uncertainty that feed into ICS emission reduction calculations. Among the inputs with the lowest degree of certainty are usage rates, as discussed below.
Cookstove usage is inherently linked to crediting risk
For introduced fuels and technologies, adoption can be divided into three stages; acceptance, initial use, and sustained use or dissadoption. Our analysis of projects in the Cookstove sub-sector finds that there are several barriers to sustained usage, including maintenance requirements, cultural preferences, and a lack of knowledge on appropriate use. If such barriers are not addressed through education, support, and maintenance, evidence suggests that cookstove adoption tends to decrease over time, a trend well-documented in peer-reviewed literature. If the abandonment of project ICS is not captured properly through monitoring, this presents an over-crediting risk as credits could be issued for stoves that are no longer in use.
Furthermore, even when ICS are not completely abandoned, if they are not meeting all of the requirements of the end-user (e.g not big enough to cook large meals for gatherings, not suited for traditional meals, poor-tasting food), then there is also the possibility that households may ‘stack’ the ICS with one or more other cooking stoves. We find that this is a common practice in regions undergoing energy transitions, where ICS projects tend to operate. For example, a household may use an ICS to cook a meal for a family, but use an LPG stove to quickly make breakfast or tea, and then may use a three-stone fire for a large gathering. Given that the use of multiple stoves is likely, the monitoring of additional stoves in the household is also essential for accurate carbon accounting.
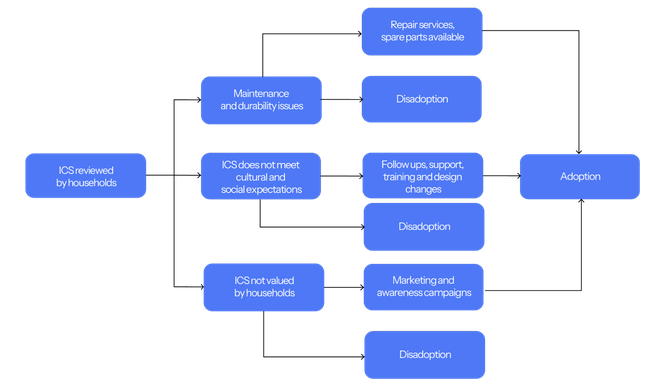
Figure 1.¹ There are several barriers to the adoption of new technologies, even for those which may provide health or economic benefits. We find that several factors, such as levels of education and awareness campaigns, barriers and maintenance issues, and whether projects perform follow-up visits and provide support, can all impact ICS adoption. If barriers such as cultural preferences, insufficient training, or stove breakages are not addressed, this can lead to the disadoption of the ICS.
Given that usage rates and the number of stoves operating are directly linked to emission reductions, it is imperative that project monitoring and associated sample sizes adequately reflect levels of adoption and usage to mitigate over-crediting.
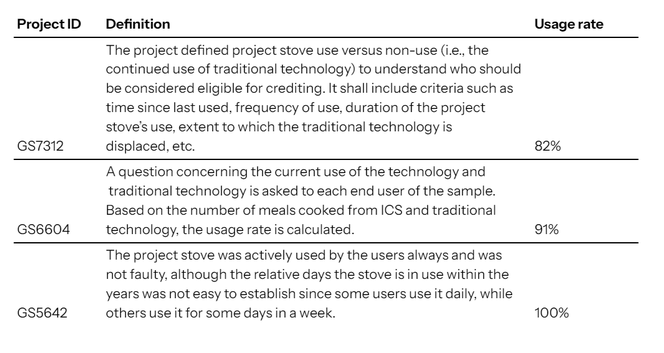
Of the cookstove projects currently rated by BeZero that disclose their usage rates (n= 21 of 21 cookstove projects, November 2023), we find the average reported usage rate to be 87%. The definition of ‘usage’ appears to be ambiguous and is oftentimes defined by the project (Table 2), as noted in a Clean Cooking Forum workshop tasked with defining adoption. However, typically this assumption means that a ‘user’ has completely adopted the ICS and does not use traditional cooking practices, whereas a ‘non-user’ may have abandoned the ICS. In this case, projects may use a ‘yes’ or ‘no’ question to decipher the usage rate. In addition, some projects also use different parameters to determine use, such as the amount of meals cooked and the duration of adoption. On average, projects are assuming that 87% of end users have completely adopted the ICS and 13% of users have abandoned the ICS and do not use it at all.
Table 2. A few examples of usage definitions adopted in project documentation.
However, we find that estimates of usage captured by academic literature tend to be considerably lower than the average usage rates reported by projects.² For example, one study in the Kampala and Wakiso districts in Uganda carried out a four month observation of stove usage and fuel consumption using survey data and stove use monitors (SUMs).³ They determined the explicit usage of ICS to be approximately 21%, yet we have found projects operating in the same area to claim usage rates of between 77-98%. Whilst this may be a result of project-specific activities, such as follow-ups and incentives, without greater transparency and holistic monitoring, this delta is a major source of uncertainty.
These uncertainties contribute to our assessment of over-crediting. In particular, we find that usage estimates tend to suffer from a very low threshold of sampling and monitoring, with the majority of projects monitoring less than 1% of all stoves distributed (Figure 2).
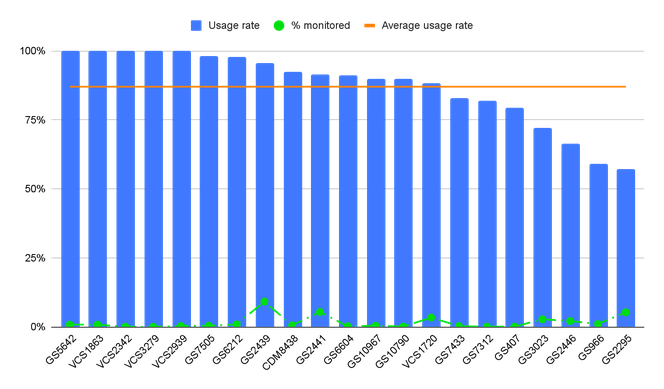
Figure 2. An analysis of reported usage rates (average across all vintages) from BeZero-rated projects finds routinely high values.
A high usage rate is not necessarily a risk - on the contrary, high usage rates can be an indication of a successful project where the ICS has adequately met the needs of the end user. However, the application of high usage rates should be considered within the project’s individual context. For example, evidence suggests that in donor-led programmes (where an ICS is often distributed for free), usage rates tend to be lower because the technology has a lower perceived value. To overcome this, projects can utilise carbon finance to provide education, training, and follow-up support, and may have much higher usage rates as a result. In addition, it is imperative to assess exactly how a project’s usage rate has been determined and what population has been sampled, as there are sources of uncertainty in different approaches. These bottom-up factors are an essential part of our analysis of the over-crediting risk associated with usage rates.
Some of the key components we assess are listed below, and will be explored in detail in this report:
Sample size - the proportion of households sampled in relation to the number of households involved in the project.
Sample stratification - whether the sample is properly representative of the entire population of end users, taking into account geographic and ethnographic differences.
Frequency and seasonality - how often samples are conducted and when they are conducted to account for seasonal differences in cooking.
Survey method - how information is collected, whether that be through direct monitoring, interviews, observations, or telephone surveys.
Recall and social desirability biases - how surveys are designed to minimise biases present in social surveys.
Methodology requirements for monitoring usage
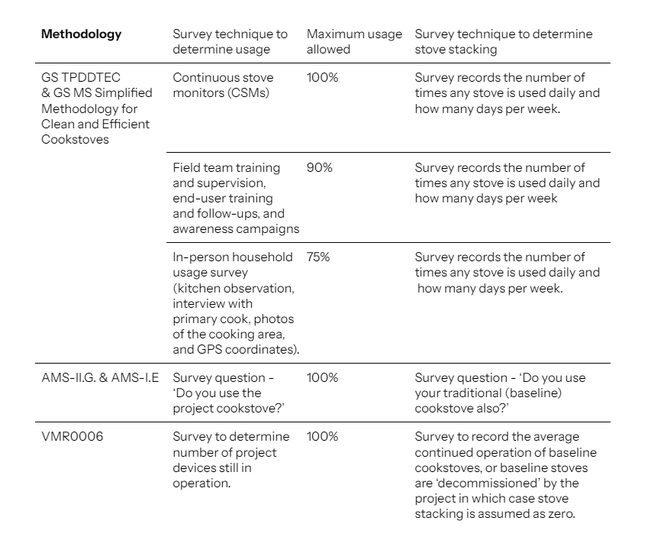
There are six main methodologies available to ICS projects under the five major standards bodies: American Carbon Registry, the Clean Development (CDM) Mechanism, Climate Action Reserve, Gold Standard, and Verra. Of these methodologies, BeZero has rated projects across five (Table 3), as credits have yet to be issued under Gold Standard’s Methodology for Metered and Measured Cooking Devices. Across these methodologies, there are various approaches in determining usage rates and stove stacking.
For instance, the Gold Standard’s Technologies and Practices to Displace Decentralized Thermal Energy Consumption (TPDDTEC) requires an interview with the primary cook, kitchen observations, photos of the cooking area, and GPS coordinates as mandatory requirements, whereas CDM’s AMS-II.G and Verra’s VMR0006 only require asking one question; whether the end-user still uses the stove.
Table 3. Overview of survey techniques and usage rate requirements for five methodologies from Gold Standard, the CDM, and Verra.
In our view, most of the survey options provided by the methodologies fall short in robustly determining usage. This has led to a systematic application of high usage rates across most methodologies, as seen in the figure below.
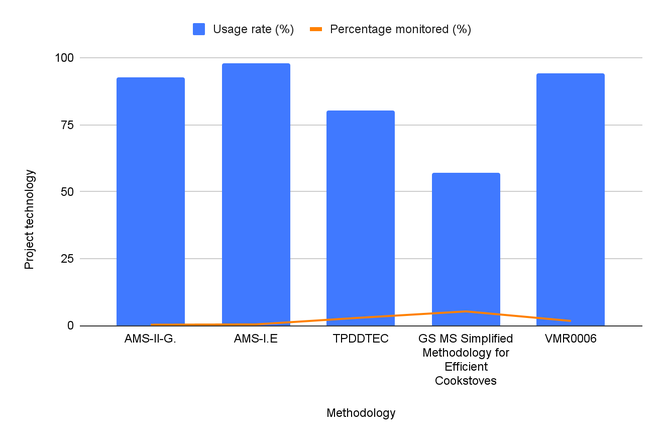
Figure 3. Average usage rate by methodology from BeZero-rated projects. We note that only one project has used the GS MS Simplified Methodology for Efficient Cookstoves, which may explain the negative skew.
We have seen market initiatives to tackle the issues of inadequate monitoring of cookstove usage, such as the Gold Standard’s Methodology for Metered and Measured Cooking Devices in 2021, as well as the introduction of capped usage rates to the GS TPDDTEC and Simplified Methodology for Clean and Efficient Cookstoves, in 2020.⁴ These updates indicate a recognition that simplistic surveys may have had limitations in accurately capturing usage rates, and that usage rates higher than 75% without continuous monitoring or follow-ups and awareness campaigns may be unrealistic. Within our rated portfolio of cookstove projects, only one has implemented this update. Further, still common across methodologies that are not utilising stove monitors is a dependence on qualitative social surveys, which leaves scope for human error, social biases, and misrepresentation.
How sample size is determined
Key to accurately estimating usage across end users is selecting an appropriate sample size and a representative population. To determine the number of households that a project should sample, all of the methodologies listed above follow the same general approach as outlined in the CDM’s Sampling and surveys for CDM project activities and programme of activities, with the exception of VMR0006 which allows a more simplified approach.⁵
The most basic version of the CDM’s approach uses a simple random sampling method and assumes a homogeneous population. When collecting annual samples, sample size is determined using a 90% confidence interval and 10% margin of error. If surveys are conducted less than once a year, a 95% confidence interval and 10% margin of error is required.
Assuming a simple random sampling approach and annual surveys, this results in the following equation:
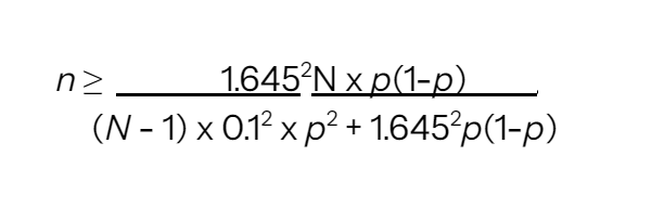
Where:
n = Sample size
N = Total number of households
p = Expected proportion
1.645 = Represents the 90% confidence required ⁶
0.1 = Represents the 10% relative precision
The level of precision (e.g. ±10% of relative value of the parameter’s true value) and confidence (e.g. 90% or 95%) in that precision is used in determining the sample size. The higher the required confidence and the narrower the precision, the more samples are required.
We find no justification in methodologies for the use of a 90% confidence interval. Social sciences and environmental studies tend to adopt a minimum 95% confidence interval, as this necessarily increases precision and reduces the chance of being wrong. Adopting a 90% significance level is generally only seen as appropriate for sampling small populations with minimal variance, as it otherwise allows for a larger chance of inaccuracy. Although the methodology guidelines have instructed that 95% confidence be used for large-scale projects, we find that this is either not enforced across the projects we have rated, or it is avoided by cross monitoring smaller activities in grouped projects.
Secondly, under this approach, projects initially have flexibility to determine an appropriate value of ‘p’ - the expected proportion of households using the ICS. After the first monitoring period, projects then have the choice to either again choose a value of ‘p’ or use the usage rate found in that monitoring period for subsequent periods, permitting a change in sample size accordingly.
How ‘p’ impacts sample size
This parameter is of particular importance as the expected proportion, ‘p’, can have a significant impact on the number of samples required by the project - the higher the value of ‘p’, the lower the sample size. This is because a higher expected proportion indicates a lower variation of responses, which in the equation above, results in a lower sample size to reach statistical significance. For instance, if we take a theoretical project that distributes stoves to 1000 households, if the project uses an expected usage rate of 50% (p = 0.5), the resulting sample would need to be 213 samples (~21% of the 1000 stoves distributed). But if the project uses an expected usage rate of 90% (p = 0.9), the required sample size is just 29 samples (~3% of the 1000 stoves distributed).
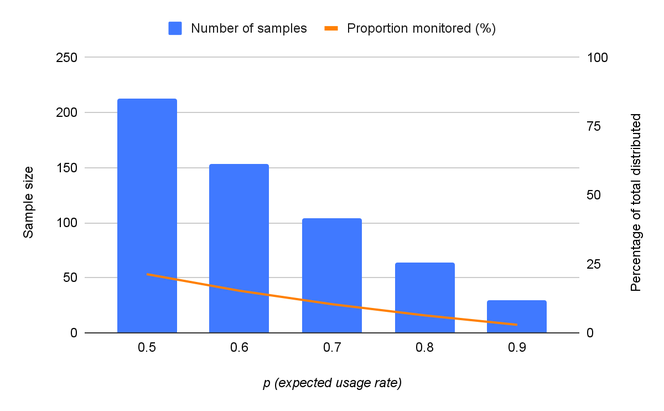
Figure 4. Using an example project of 1000 households, sample size decreases as the expected usage rate increases (shown by the bars). Conversely, the percentage of stoves monitored in this theoretical 1000 household study also decreases (shown by the red line).
We find a range of expected proportion values applied by projects that BeZero has rated, with the majority of projects not disclosing this information at all. This may be because the requirements to determine this value are not particularly stringent, with the option of either: (1) referring to the results of previous studies, (2) taking preliminary samples as a pilot to provide estimates, or (3) using ‘best guesses’ based on the researcher’s own experiences.
Given the costs associated with surveying, projects may favour smaller sample sizes. Projects using a ‘best guess’ approach are not required to rely on peer-reviewed studies or empirical data, and therefore may select higher values of ‘p’ given these added costs. Referring to the results of previous studies or using a pilot study are more robust options, however there is no requirement to disclose the underlying details of such studies and/or pilot programmes, creating information risk.
We find that the average number of cookstoves distributed by projects that BeZero has rated is about 120,000 (and therefore they claim emission reductions over the 60 kt CO2e per year threshold for large-scale projects), yet the average sample size monitored is approximately 200, partially as a result of a lower confidence interval. Whilst increasing sample sizes will necessarily reach a point of diminishing returns, we would nonetheless advocate for projects to adopt confidence and precision requirements that align with best practices in the scientific literature, as well as conducting transparent and robust pilot studies to determine expected usage values. Following these steps is unlikely to increase sample sizes to an unmanageable level, meaning improved accuracy can be achieved at little additional cost. However, these improvements relate to discrete samples, which in turn should be based upon distinct populations, as discussed below.
Characteristics of the sample population
In addition to sample size, capturing the various population characteristics is also essential to accurate monitoring. In order for surveys to generate reliable information, it is important that the sample population is representative of the entire target population; in this case, end-users of ICS.
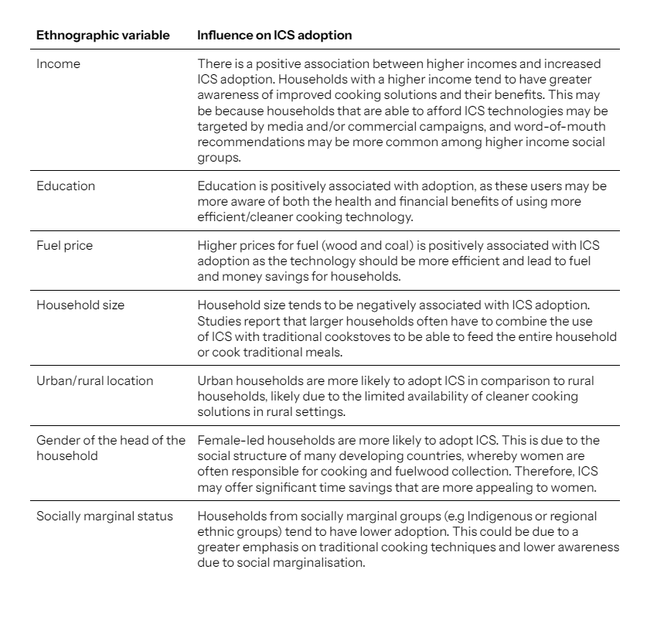
We find that many ICS projects operate at a national scale, with stoves distributed to multiple demographics across the country. Even in those cases where projects operate at a more local level, we find that there can still be distinct populations of end users with different traits that may affect cooking practices. It is therefore common for stoves to be distributed to heterogeneous populations and in such instances, it is best practice to adopt a stratified approach and sample multiple population groups that represent different characteristics. Despite this, we find that the majority of projects that BeZero has rated assume a homogeneous population. In Table 4, we outline several ethnographic variables that can influence ICS adoption.
Table 4. Key characteristics of households that have an influence on ICS and clean cooking adoption, collated from peer-reviewed studies across Africa, Asia, and Latin America.⁷
Case study of an ICS project in Malawi
To illustrate how projects sampling under the assumption of a homogenous population may not capture cookstove adoption across their target population, we examine one project in Malawi operating on a national scale. According to publicly available documents, this project has distributed 348,043 stoves (as of September 2022) across all regions of Malawi, yet stated that the population is homogenous and therefore determined a simple random sample size of only 48 households (assuming an expected usage proportion of 0.85). Meanwhile, the project reports that 100% of stoves are in operation. As seen from the map below, the project distributes stoves across 19 districts in Malawi, yet eight of those districts where approximately 7,200 end-users are located were not sampled.
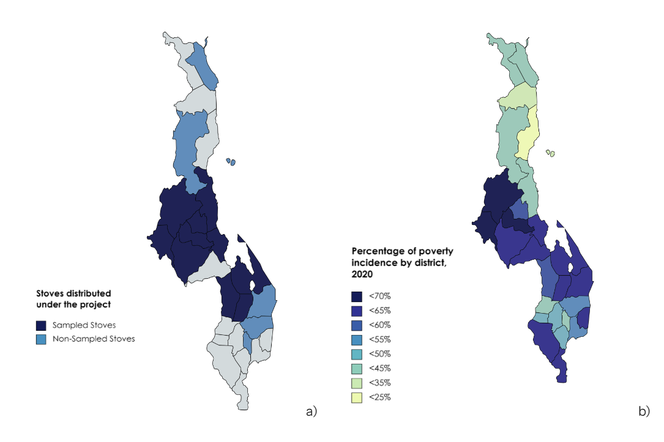
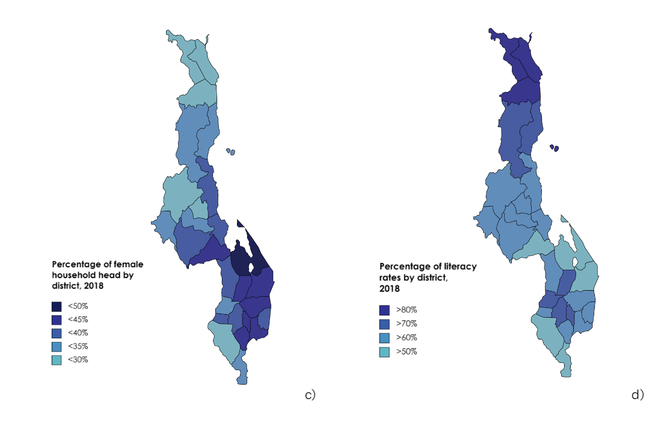
Figure 5. Project distribution and ethnographic variables across districts in Malawi. a) Map showing project distribution and sampling of stoves. We also note that the sampling within districts is not holistic to cover intra-variation, such as the rural/urban dichotomy. b) Map showing poverty incidence in Malawi districts. c) Map showing the households that have a female head of house. d) Map showing literacy rates across Malawi. Given the ethnographic variation between districts, assuming a homogenous population and not sampling households in every district may lead to unreliable results.
While the project assumes a homogenous population, we find that household characteristics vary significantly between the districts in Malawi that the project targets (Figure 5). For example, we find ranges of value for poverty levels - given as the proportion of people living below the national poverty line- as well as education, gender of the head of the house, and other ethnographic variables.
This example demonstrates how key variables such as the levels of poverty within districts can vary significantly, despite the project assuming a homogenous population. While we find that within non-sampled districts the average percentage of poverty is lower (38.1%) compared to sampled districts (60.9%), outliers remain such as Machinga and Zomba where poverty levels are high. Furthermore, levels of stove stacking tend to be higher among populations with higher incomes where the project has sampled much less. This aligns with peer-reviewed literature, which states that in high income areas of Malawi stove stacking is more prevalent, given that households have greater access to a variety of stoves and fuels than their poorer counterparts. ⁸
Overall, we find that the sample size is likely to be insufficient given the diversity in ethnographic variables among districts in Malawi. If random sampling was stratified at a district level, the total sample size could potentially increase by about 720 stoves if the same expected proportion of 0.85 is assumed, or even almost 3,850 if a more conservative 0.5 expected proportion was used.
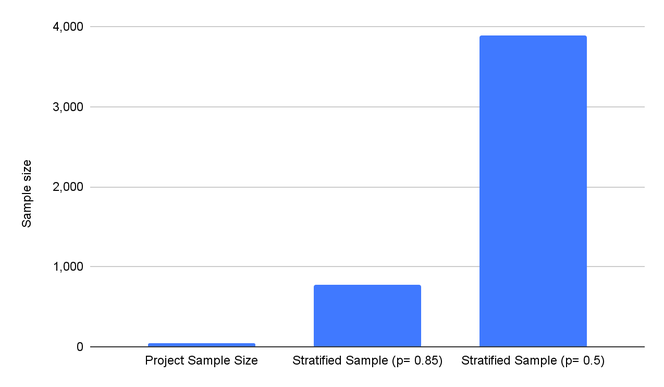
Figure 6. Project sample size compared to theoretical sample sizes using a stratified approach for each district of Malawi.
However, it is worth noting that even within districts, the population is unlikely to be completely homogenous. For example, in the Dedza district where the majority of project stoves are distributed, there are reported to be over 3,700 different villages. Further, most districts contain a mixture of both rural and urban areas that are not differentiated by the project, despite being a major factor in ICS adoption and accessibility. Therefore, even sampling based on a homogenous population is unlikely to capture all the variance in households across Malawi and may lead to unreliable usage estimates.
Projects may assume a homogenous population and consequently, sample a lower number of households, even with large project boundaries. However, in order to truly understand how households are using the new technology, sampling a higher proportion of households and ensuring stratification across such factors as regions, income levels, and family sizes can ensure more accurate capture of stove adoption. While we maintain that even higher proportions of sampling still have uncertainties in comparison to stove use monitors, using conservative approaches to determining a project’s sample size, which includes representative sampling to account for geographic and ethnographic variations may reduce some over-crediting risk.
Survey techniques
In addition to sample size and selection, the method of data collection can also greatly influence the results of a usage study. Critical elements include how the survey was conducted (in person/ telephone), when (frequency and seasonality), and triangulation with supporting evidence (validating data through cross verification of these different techniques).
Survey method
Standard survey methods can include both in-person and remote monitoring methods such as telephone surveys. Of the projects that BeZero has rated, we find that the majority conduct in-person surveys, and 13% relied on telephone-only or a mixed method. We find that of those options, in-person surveys are more robust as enumerators can visually inspect the stoves, take pictures, and if trained, can also assist with any maintenance or questions the end-users may have. Telephone surveys leave more room for inaccuracy as there is no physical inspection of the stoves to see if they have been in use recently and verify interview responses.
Telephone surveys are also unlikely to capture a representative sample of households, particularly in developing countries where most cookstove projects are located. This is because these surveys may exclude project participants who are of a lower socioeconomic status and do not have internet access or communication technology, which as discussed above can impact ICS adoption.
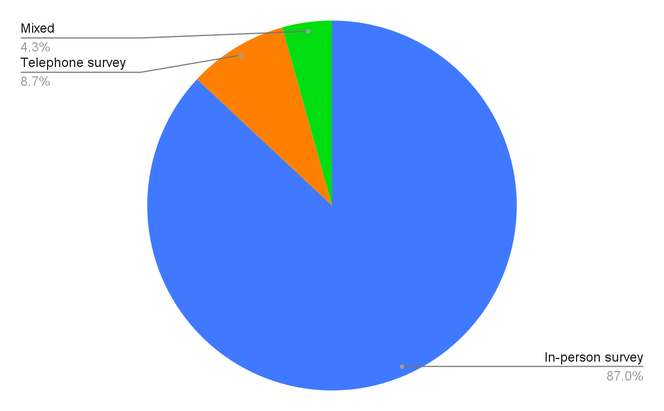
Figure 7. Percentage of surveys conducted in-person, over the phone, or a mix of the two in BeZero-rated cookstove projects.
Frequency and seasonality
Another factor to consider is the frequency of sampling. While continuous monitoring over the course of the entire crediting period would be the most robust frequency of sampling, this is often not feasible. Instead, some methodologies, such as AMS-II.G and VMR0006, only require usage surveys to be conducted once every two years.
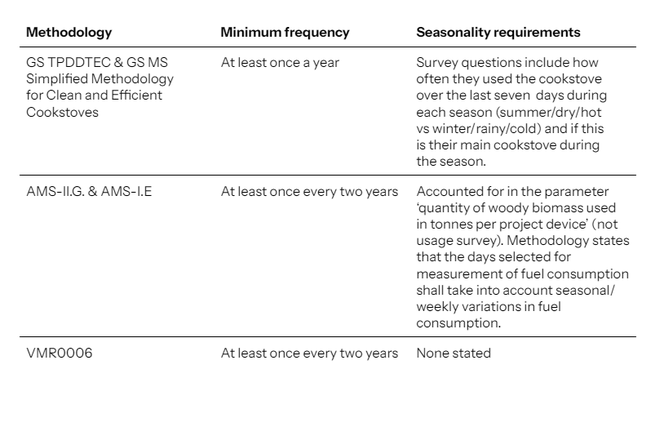
Table 5. Overview of frequency and seasonality requirements of five major cookstove methodologies.
Our analysis of peer-reviewed literature finds that often, ICS usage follows a decreasing trend over time. For example, one recent study in India found that temperature sensors on cookstoves detected an overall decreasing trend in ICS usage over the course of the study, with less than 10% of households using the ICS by the end of the 97-week study.⁹ This could be due to problems with stoves breaking down or not working properly, as well as stoves not meeting evolving users needs, such as for the cooking of traditional meals or sufficient quantities of food. This further supports the need for more frequent monitoring of ICS usage, at the very minimum annually, as well as monitoring of stoves stratified by age to capture potential abandonment.
Seasonality can also play a large role in cookstove use, particularly for stoves relying on fuelwood. For instance, we find evidence that certain stoves are unable to consume wet or cold wood, or may take more time to heat up and cook, thereby decreasing efficiency. Academic literature on ICS use in Africa and Latin America has found that the burning of wet wood in an improved stove can be more difficult or not possible in comparison to a traditional three-stone fire, so households are likely to revert back to baseline practices. Seasonality can also influence cooking habits, as in warmer weather households may rely on cold foods and cook less, in comparison to colder or wetter seasons when there may be a preference for warm meals. Therefore, seasonal weather patterns and climate dynamics are likely to influence cooking habits and usage rates. It is therefore important that monitoring surveys are undertaken across all seasons in order to avoid over or underestimations of stove usage and stacking.
Triangulation with supporting evidence
The collection and combination of multiple data points, both qualitative and quantitative, known as triangulation can also increase the validity of results. As seen in Table 3, methodologies differ greatly in their approach to triangulation with supporting evidence. Gold Standard’s methodologies require several pieces of supporting evidence to corroborate claims, including mandatory kitchen observation, interviews with the primary cook, photos of the cooking area, and GPS coordinates. Verra’s VMR0006 and CDM’s AMS-II.G on the other hand encourage a physical check of stoves, yet this does not appear to be mandatory.
We find that triangulating with multiple monitoring methods can be useful as it provides an extra layer of validation. For example, photos of the entire cooking area can capture whether other stoves are still in use, whilst kitchen observations (e.g feeling the stove to see if it is hot) can corroborate claims of usage. Supporting evidence such as photos and GPS coordinates are also essential as an additional measure of transparency to ensure that stoves are actually distributed and in use as projects claim they are.
Human error and bias
Alongside the who, when, and where, how surveys are conducted is also critical to obtaining accurate information. Under all methodologies, surveys primarily rely on interviews with the primary cook. Depending on the types of questions asked, these surveys can leave room for social biases and misinterpretation. Two forms of bias that we find social surveys to be particularly susceptible to are recall bias and social desirability bias.
Recall bias
Recall bias occurs when interview subjects have difficulty in recalling past events, particularly when asked open-ended questions. For example, a user may have more difficulty answering ‘how often do you use the ICS?’ compared to ‘how many times did you cook with the ICS yesterday?’. Such broad questions may also not be able to pick up on the nuances of cooking in many countries where projects are located. For instance , households may be using their ICS in the mornings to make tea as it boils water quicker, but may use a traditional stove to cook dinner for their family due to size or taste preferences. This presents an over-crediting risk as this household would likely be marked as a ‘user’ of the project stove and credited for all displaced baseline cooking activity, when in reality they may only use it for a small portion of cooking. Such nuances would therefore not be picked up by survey questions asking simply if the stove is in use or not.
Social desirability bias
Social desirability bias can occur when interview subjects follow cultural norms and report socially desirable behaviours when answering questions, either subconsciously or otherwise. In the case of cookstoves, this can lead to the underreporting of socially ‘undesirable’ activities and the overreporting of socially ‘desirable’ ones (i.e using the new stove).¹⁰ These biases can be more common when interviews are conducted in a public setting, which is often the case in developing countries where the majority of projects are located. For example, it may be inappropriate for a male surveyor to speak privately with a female cook, which may lead to interviews occuring in the common areas of the household or even outdoors, therefore potentially impacting her answers.¹¹
This effect can be especially prominent in the case of carbon credit projects as households may have the stove removed if they are found to be non-users, or they may feel guilty for not using the stove if it was given to them for free, both of which may prompt dishonesty. Participating households may also be aware of the financial gain for project developers from reporting higher adoption rates and may therefore want to please researchers by showing that they are using the technology.¹² This is a form of social bias called the Hawthorne effect, whereby households change their behaviour due to the presence of researchers.
The rise of stove use monitoring
In light of the uncertainties associated with current monitoring practices, in recent years stove use monitors have emerged as a more precise and quantitative measure of tracking ICS usage. There are several types of monitors available for cookstove projects; most often, small wireless devices equipped with temperature loggers to track when the stove is in use. Alternatively, some electric or LPG stoves are designed to incorporate and measure fuel consumption directly. Other forms of measuring fuel consumption, including purchase history, may also provide supplementary evidence to usage assumptions. These methods generally confer greater reliability as they are not subject to human error and the biases discussed above.
As evidence of this, we find that several academic studies have documented the consistent over-reporting of stove adoption and usage from surveys versus sensor-recorded data.¹³ For example, one study in India found that during in-person measurements, observed ICS use increased by approximately 53% while traditional stove use fell by approximately 29% relative to the remote monitoring data.¹⁴ However, sensors recorded a complete reversal in this behaviour after the in-person monitoring was complete. This further reinforces the importance of stove monitoring units (SUMs) to conduct unobtrusive monitoring.
However, although these approaches tend to be more objective and less subject to uncertainty, there are still limitations. For example, under the Gold Standard Metered & Measured methodology, projects are still eligible to only sample a small subset of stoves using the general requirements. There are also examples of projects that track fuel consumption but don’t necessarily rely on this information for emission reduction purposes. In addition, SUMs are unable to capture the dynamics of stove stacking.
Objective and quantitative techniques to monitor stove use do represent a more robust approach, but uncertainties still exist.
Conclusion
Accurate monitoring of ICS is paramount to calculating emission reductions. We find that current approaches face systemic challenges and uncertainties, such as sample size assumptions, when and where monitoring takes place, and how surveys are conducted, leading to significant over-crediting risk in the majority of BeZero-rated cookstove projects.
Moreover, although there are new developments in the field, these are by no means the panacea given that they are not currently mandated across all methodologies. As such, we recommend that projects utilise a combination of quantitative and qualitative practices, adopting conservative assumptions and maximising sample sizes, populations, and frequencies where feasible. In addition, it is important to note that this is just one aspect of emission reductions, and projects still face over-crediting risk from other components such as fNRB and stove efficiency assumptions, as detailed in our ratings and other Insights.
References
¹ Adapted from Carrion et al., 2020
² Johnson et al., 2009; Mercado et al., 2011; Hanna et al., 2012; Mobarak et al., 2012;
⁴ First introduced in Gold Standard’s Cookstove Usage Rate Guidelines in 2020, included in 2021 revision to TPDDTEC (v4.0)
⁵ Minimum sample size of 100 for project populations greater than 1000; 10% of group size for populations between 300-1000; 30 for project target populations less than 300
⁶ The value 1.645 is the z-score from a standard normal probability distribution with 90% confidence
⁷ Lewis & Pattanayak, 2012; Wolf et al., 2017; Agbokey et al., 2019; Jan et al., 2017
¹³ Hing et al., 2023; Ramathan et al., 2017; Wilson et al., 2015; Thomas et al., 2013; Piedrahita et al., 2016