
Towards efficiency: Carbon credit pricing and risk
Establishing price-rating correlation for carbon credits
Executive summary
There continues to be a meaningful correlation between BeZero rating and the price of carbon credits.
On average, over the period since the launch of BeZero ratings in April 2022, there has been a 25% price difference between credits separated by one BeZero rating notch (e.g. ‘C’ and ‘B’ or ‘BBB’ and ‘A’).
In the same period, the average price premium for credits with BeZero ratings of ‘A’ or above has been around 80% above other BeZero-rated credits.
There has been considerable growth in the price premium for higher-rated credits over the last 18 months, in particular through the second half of 2023.
In recent months, the average price difference between credits separated by one BeZero rating notch has grown to around 40%, and the average price premium for credits in the higher BeZero rating categories of ‘A’ or above has risen rapidly to 200%.
This indicates that BeZero ratings are increasingly an important factor driving the pricing of credits in the voluntary carbon market.
Introduction
Having launched BeZero Carbon Ratings in April 2022, and with the update to our eight-point rating scale in March 2023, our framework is now established as a cornerstone of market analysis used by developers, investors, buyers and regulators.
The goal of ratings data is to arm market participants with risk information, giving them a new and valuable input into price discovery and helping to make the market more efficient.
To date, we have published 379 ex post project ratings, which are available to view on our website, and we have a large and growing number of clients accessing the data underpinning our ratings via the BeZero Carbon Markets Platform. Our ratings are live on the major exchanges including Xpansiv CBL and Viridios, and our ratings updates are regularly reported by industry outlets.
Our analysis in January 2023 showed that, only a few months after launch, a relationship was beginning to develop between BeZero rating and credit price. This report updates that research using pricing data from Xpansiv’s CBL exchange for the period from April 2022 - December 2023, representing transactions of over 50 million carbon credits. We have matched each transaction, including its actual trading price (adjusted for inflation) with the BeZero rating at the time of transaction (where a rating was available). A summary of the key findings from the analysis undertaken using this dataset is presented in the following pages.
Average price-rating relationship
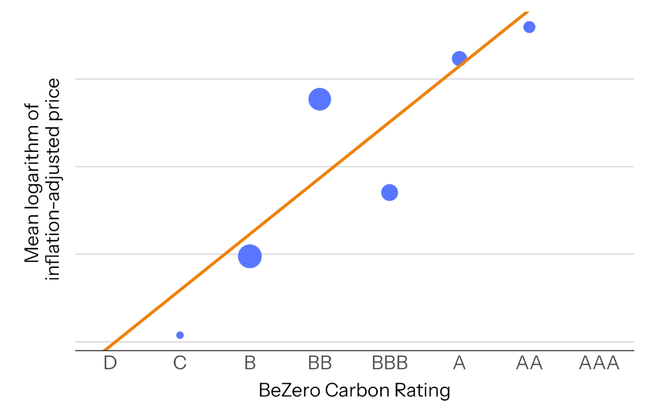
Figure 1. Average price and rating relationship April 2022 - December 2023. The number of transactions for credits of each BeZero Carbon Rating in the period analysed is indicated by the size of the data point. Analysis uses transacted price data from Xpansiv CBL market.
We find that, on average, the price difference between credits separated by one BeZero rating notch (e.g. ‘BBB’ and ‘A’ or ‘C’ and ‘B’) has been 26%, with a standard error of +/- 2%.¹
The graph above illustrates a stylised version of the regression used to produce this result, showing mean values rather than individual data points. It is notable that the average price for ‘BBB’-rated credits is lower than for ‘BB’-rated credits. This is a consequence of a number of low-value transactions in late 2023 for one specific ‘BBB’-rated project. With this project excluded from the dataset, the average price of ‘BBB’-rated credits is higher than ‘BB’-rated credits, as would be expected.
Simplifying the analysis to consider the average price premium for credits in the highest BeZero rating categories, we find that, on average, the price difference between credits with a BeZero rating of ‘A’ or higher compared to those with a BeZero rating of ‘BBB’ or lower has been 79%, with a standard error of +/- 8%.²
Variation in price-rating relationship over time
As well as considering the average relationship between April 2022 - December 2023, we have examined how the relationship between price and BeZero rating has varied across this period. We have undertaken this assessment by running the regression analysis described above for a rolling series of six-month periods, starting from April - October 2022, and ending June - December 2023.
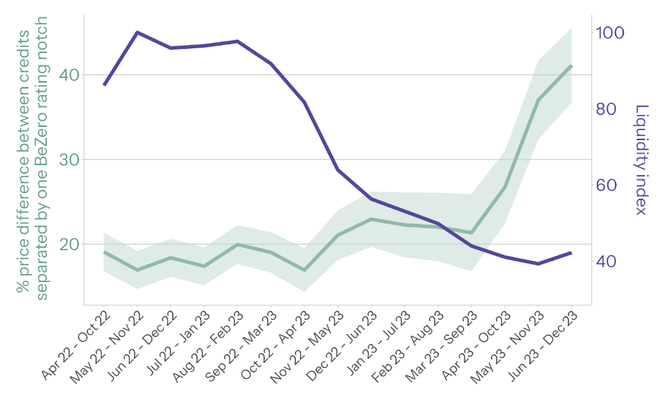
Figure 2. Average price difference between credits separated by one BeZero rating notch for a series of six-month analysis periods running from April - October 2022 to June - December 2023. Standard error on average price difference is indicated by the shaded area. Liquidity index is included on a secondary axis.³ Analysis uses transacted price data from Xpansiv CBL market.
We observe that the average price difference between credits separated by one BeZero rating notch (e.g. ‘BBB’ and ‘A’ or ‘C’ and ‘B’) has risen considerably in recent months, from around 20% to around 40%.
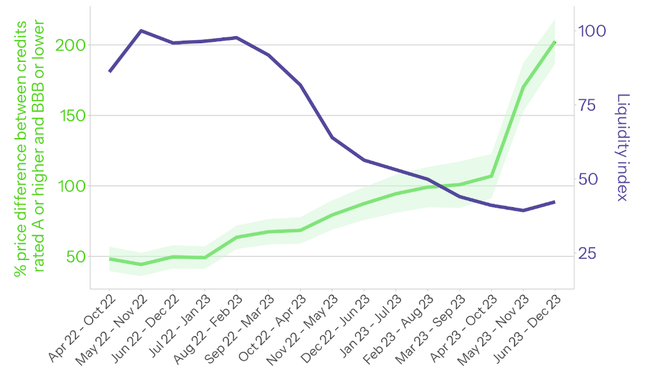
Figure 3. Average price difference between credits with a BeZero rating of ‘A’ or higher compared to those with a BeZero Carbon Rating of ‘BBB’ or lower for a series of six-month analysis periods running from April - October 2022 to June - December 2023. Standard error on average price difference indicated by shaded area. Liquidity index included on a secondary axis. Analysis uses transacted price data from Xpansiv CBL market.
We observe that the average price difference between credits with a BeZero Carbon Rating of ‘A’ or higher compared to those with a BeZero Carbon Rating of ‘BBB’ or lower rose steadily from 50% up to 100% before rising more rapidly to 200% in recent months.
In summary, Figures 2 and 3 show that over the last 18 months, and particularly over the last six months, the price premium for carbon credits with higher BeZero ratings has increased considerably. This constitutes evidence that BeZero ratings are increasingly an important factor driving the pricing of credits in the voluntary carbon market.
Several factors are likely to be driving the observations described above. There is anecdotal evidence that credits rated ‘A’ or higher by BeZero are particularly popular with credit purchasers, and this is backed up by the trend seen in Figure 3. As shown by our previous analysis, low liquidity tends to reduce the price-rating relationship since the degree of price discovery decreases, leading to less efficient pricing. The fact that the relationship between BeZero rating and price has grown stronger through a period of declining liquidity adds further credence to the observations. Indeed, the particularly significant growth in the price-ratings relationship in recent months may be in part due to the levelling-off of liquidity in the same period. Going forward, if the market can rebound and attract a larger number of participants, we expect the relationship between BeZero Carbon Rating and price to strengthen further.
Further work
This report has highlighted the developing relationship between BeZero Carbon Rating and price, which we will monitor regularly and continue to report on. We intend to expand our analysis by incorporating data from other pricing sources, including those with coverage of over-the-counter trades. Developing our dataset will also enable us to consider more in-depth questions such as the price-rating relationship within specific sectors. If you would like to make any suggestions for BeZero’s research pipeline on this topic, please get in touch.
References
¹ The analysis controlled for the vintage of the credit purchased in each transaction, to account for the general willingness of buyers to pay a higher price for more recent vintages. In addition, the analysis used the logarithm of price, since this enables the regression coefficient to be interpreted in terms of the percentage increase in price per BeZero Carbon Rating segment. Without the logarithmic specification, the coefficient would be interpreted as the absolute increase in price (in USD) per rating segment, a less meaningful measure due to the volatility of average credit prices over time.
² This result was determined using a similar regression methodology to that described in footnote 1, but using a binary indicator for credits rated ‘A’ or higher.
³ Liquidity index refers to the volume of transactions within each period under consideration, rebased such that the maximum value = 100.
Sources
Pricing data from Xpansiv’s CBL market
Data for inflation adjustment from the US Bureau of Labour Statistics
Data for currency conversion from the Federal Reserve Bank of St. Louis