Snapshot: the current carbon removal market in figures
Contents
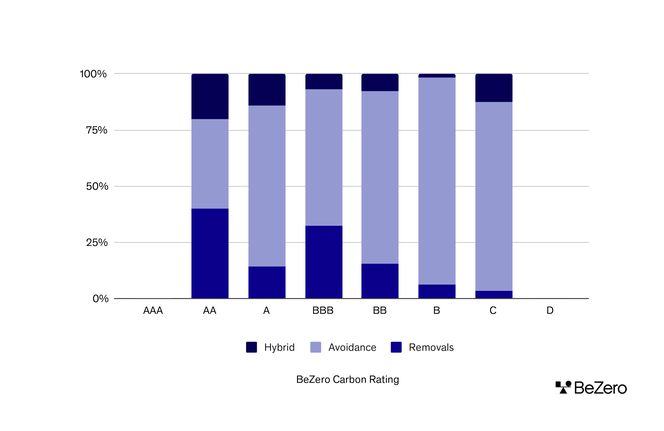
- Removal credits have relatively high average BeZero Carbon Ratings.
- The engineered carbon removal capacity needs to reach gigatonne scale if we are to meet climate targets.
- We cannot hit IPCC targets through nature-based carbon removal alone.
- Engineered carbon removals are living in the future.
- Biochar dominates the ex-post carbon removal market, making up 89% of all retired engineered carbon removal credits.
- Biochar has some of the lowest barriers to scaling of any engineered carbon removal method, whereas Ocean Alkalinity Enhancement has some of the highest.
- Bio-energy with carbon capture and storage (BECCS) and direct air capture with carbon storage (DACCS) dominate the ex-ante market.
- Failing to bring down the cost curve of engineered carbon removals could cost high-emitting sectors such as the aviation sector in the long-term.
Removal credits have relatively high average BeZero Carbon Ratings.
The share of removals projects increases in the top rating categories.
For avoidance credits the opposite is true: lower ratings tend to have a higher share of avoidance projects.
Removal and hybrid projects make up 60% of projects rated ‘AA’, yet these credit types account for only 19% of all projects rated by BeZero Carbon.

Figure 1: Percentage distribution of avoidance, removal and hybrid projects by number rated on the BCR.
Source: BeZero Carbon
The engineered carbon removal capacity needs to reach gigatonne scale if we are to meet climate targets.
The engineered carbon removal market is nascent and faces an uphill struggle to scale to the levels necessary - 10 billion tonnes a year - to meet climate targets.
Currently, the majority of annual carbon removal is achieved through afforestation, reforestation and restoration (ARR), with engineered carbon removal approaches accounting for just 0.12% of total removal in 2022.

Figure 2: Estimated annual carbon removal in GtCO2. The majority of carbon removal is currently met through afforestation, reforestation and restoration (ARR) (blue) with only 0.12% met by engineered carbon removal methods (red). Source: State of CDR, 2023
We cannot hit IPCC targets through nature-based carbon removal alone.
Fulfilling the ambition of 10 gigatonnes of carbon removal annually would require the afforestation of 11.3 million square kilometres, equivalent to 7% of the earth’s land area or the land area of the entire United States.
Engineered carbon removal methods, which are less land-intensive, are necessary.

Engineered carbon removals are living in the future.
In total, 3.9 million credits of engineered carbon removal have been purchased to date.
Due to the nascent nature of the industry, just 73,628 credits (1.9% of total) have been delivered.
For context, in the voluntary carbon market (VCM), 1.8 billion credits have been issued to date and 821 million credits (46%) have been retired.

Figure 3: Percentage of engineered carbon removal credits delivered and undelivered.
Source: cdr.fyi, 2023
Biochar dominates the ex-post carbon removal market, making up 89% of all retired engineered carbon removal credits.
Biochar is the most technologically mature of all engineered carbon removal methods. It therefore is further along the innovation curve and has a higher supply of credits.
The numbers are still low by voluntary carbon market standards, with just 67,000 credits sold to date. In 2022, there were 290 million issuances in the VCM globally.

Figure 4: Proportion of delivered credits that are Biochar.
Source: cdr.fyi, 2023
Biochar has some of the lowest barriers to scaling of any engineered carbon removal method, whereas Ocean Alkalinity Enhancement has some of the highest.
In January 2023 we launched our Scalability Assessment. In this first-of-its-kind analysis we evaluated five engineered carbon removal methods, including Biochar and Ocean Alkalinity Enhancement. Read our Scalability Assessment here (Introduction, Methodology, Summary).
The assessment revealed that Biochar faces some of the lowest relative barriers to scaling compared to the other methods. There are current scaling opportunities: third-party verified methodologies, low costs, developed ancillary value chains and the potential for energy production. That being said, land-use remains a relatively high barrier to scaling, depending on biomass sourcing and storage location.
The assessment revealed that Ocean Alkalinity Enhancement faces some of the highest relative barriers to scaling compared to other methods. In particular, this method is constrained by large regulatory barriers, poor public perception, and undeveloped monitoring, reporting and verification practices.

Figure 5: Barriers to scaling for Biochar and Ocean Alkalinity Enhancement
Source: Scalability Assessment for Carbon Removal, BeZero Carbon, 2023
Bio-energy with carbon capture and storage (BECCS) and direct air capture with carbon storage (DACCS) dominate the ex-ante market.
BECCS and DACCS make up a combined total of 85% of all undelivered credits sold in the engineered carbon removal market.
Two large pre-purchases skew these results in favour of BECCS and DACCS. Including:
Microsoft’s May 2023 purchase of 2.76 million BECCS credits from Orsted.
Airbus’s March 2022 purchase of 400,000 DACCS credits from 1PointFive.

Figure 6: Undelivered credits by credit type
Source: cdr.fyi, 2023
Failing to bring down the cost curve of engineered carbon removals could cost high-emitting sectors such as the aviation sector in the long-term.
Both sustainable aviation fuels (SAFs) and engineered carbon removals will be necessary to decarbonise the aviation industry.
If these methods are not brought down the cost curve, ticket prices could be as much as 230% higher by 2050.
In an optimistic scenario, where planes only use SAFs as fuel and remove the remaining carbon emissions using engineered carbon removal at $100 a tonne, ticket prices could rise by 49% by 2050.

Figure 7: Projected change in flight ticket costs by 2050
Source: BeZero Carbon Analysis