
Rating two years in carbon markets
Here are some key takeaways
In April 2022, BeZero launched the world’s first publicly available global carbon rating framework, providing the market with a risk metric for assessing quality of more than 180 projects.
As April 2024 beckons, and with BeZero now having rated over 400 projects, we reflect on a breathless 24 months in carbon markets, taking a look at market trajectory and trends in demand, pricing and policy backdrop.
This 24-month view shows the promise of a return to growth in demand, an increasing influence of market innovations like ratings on price, demand and quality, all combined with a highly energetic and dynamic policy environment.
This gives much to be confident about in the future of carbon markets and the hope that high functioning, high impact carbon projects will deliver on their climate promises and financial potential at a global scale.
Following a sluggish period, growth in retirements has returned to the VCM
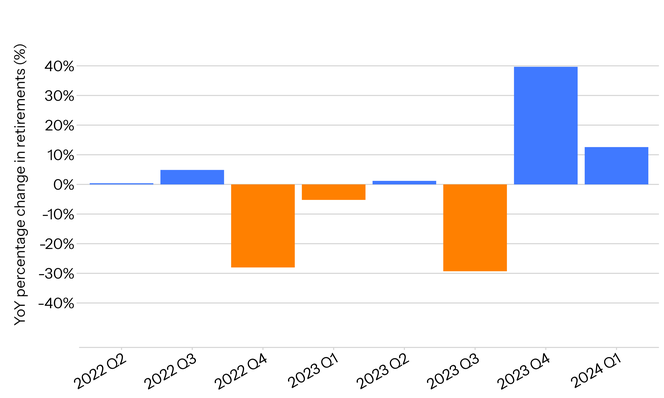
Figure 1: Year-on-year percentage growth in quarterly retirements for 2022 Q2 - 2024 Q1. Data for the last few days of 2024 Q1 was estimated based on the average retirements per day for the quarter. Covers retirements of credits accredited by American Carbon Registry, Cercarbono, Climate Action Reserve, Gold Standard, Puro.Earth, and Verra.
Quarterly credit retirements in 2024 Q1 and 2023 Q4 grew year-on-year following a period of stagnation that began in 2022 and continued throughout most of 2023.
Demand for higher rated credits has risen in the last two years…
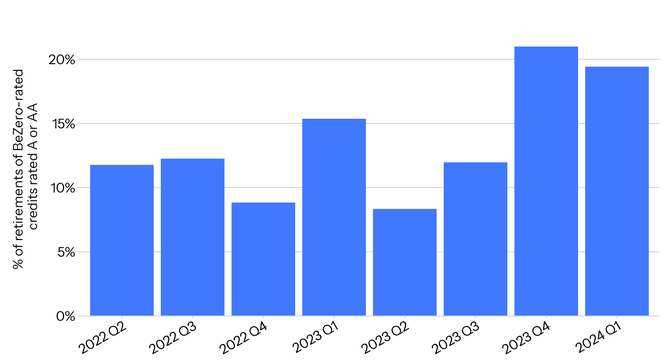
Figure 2: Percentage of retirements of BeZero-rated credits rated A or AA, for 2022 Q2 - 2024 Q1. Covers retirements of credits accredited by American Carbon Registry, Cercarbono, Climate Action Reserve, Gold Standard, Puro.Earth, and Verra.
Retirements of credits rated A or AA by BeZero have risen relative to those of other BeZero-rated credits since the introduction of the BeZero Carbon Rating. This is particularly evident in the last two quarters, where the percentage of retirements of BeZero-rated credits rated A or AA has been around 20%.
…while demand for lowest rated credits has plummeted
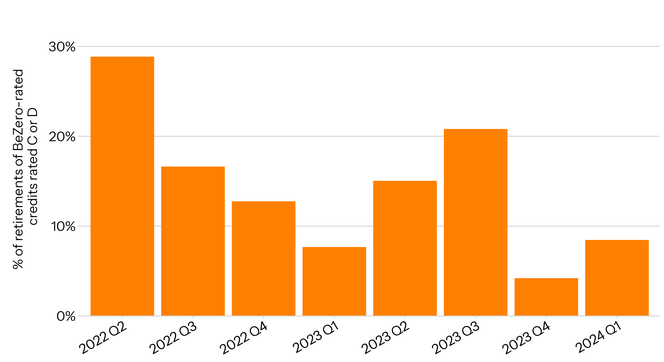
Figure 3: Percentage of retirements of BeZero-rated credits rated C or D, for 2022 Q2 - 2024 Q1. Covers retirements of credits accredited by American Carbon Registry, Cercarbono, Climate Action Reserve, Gold Standard, Puro.Earth, and Verra.
Retirements of credits rated C or D by BeZero have dropped relative to those of other BeZero-rated credits since the introduction of the BeZero Carbon Rating. As above, this is particularly evident in the last two quarters, where the percentage of retirements of BeZero-rated credits rated C or D has fallen to <10%.
Following a period of decline, there are signs of price recovery in recent months
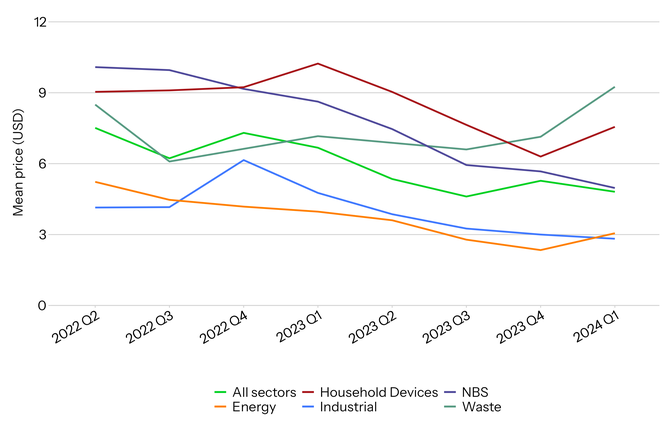
Figure 4: Mean transacted price per credit for all sectors and specific sector groups, 2022 Q2 - 2024 Q1. Pricing data from Xpansiv’s CBL exchange.
The mean transaction price per credit across all project sectors in the VCM has fallen from around 8 USD to around 5 USD between 2022 Q2 and 2024 Q1. However, there are signs of prices rising in some sector groups over the last two quarters, in particular Household Devices and Waste.
The relationship between price and BeZero’s ratings has strengthened over the last two years.
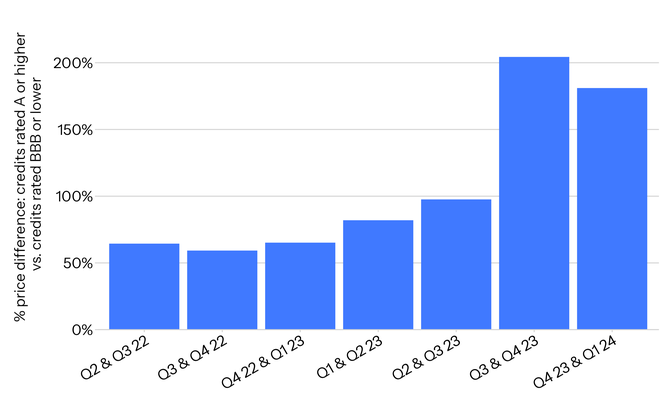
Figure 5: The average percentage price difference between credits with a BeZero rating of A or higher vs. credits with a BeZero rating of BBB or lower for 6-month periods from 2022 Q2 - 2024 Q1. Pricing data from Xpansiv’s CBL exchange.
Since the introduction of the BeZero Carbon Rating in April 2022, there has been a steady increase in the % price difference between credits rated A or higher compared to those rated BBB or lower. The price premium for higher rated credits has risen substantially over the last 9 months in particular, reaching around 200%.
This price-ratings relationship holds across both avoidance and removals credits
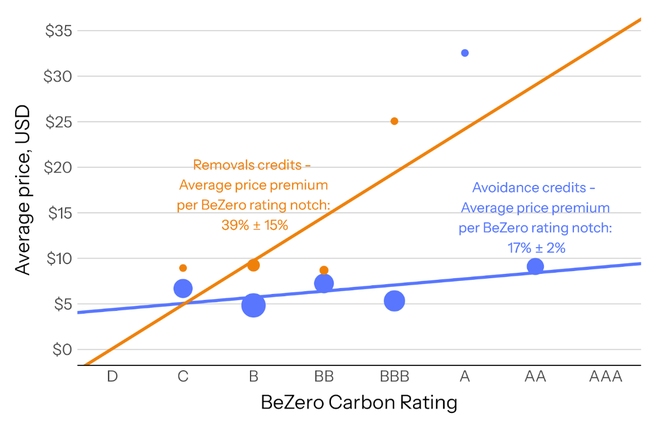
Figure 6: Average price per BeZero Carbon Rating notch for avoidance and removals projects for the period April 2022 - March 2024, with linear regression lines. Pricing data from Xpansiv’s CBL exchange.
During the period April 2022 - March 2024, there was a positive and statistically meaningful correlation between BeZero rating and price across credits for both removals and avoidance projects. For removals credits, the average price premium per BeZero rating notch was around 40% while for avoidance credits it was around 20%.¹
Innovations across the market are gaining traction
New technologies that remove carbon are increasing their funding and development. Improved satellite imagery and other technological developments provide better information for assessing projects, from risk based interventions like ratings and insurance through to innovations in MRV. And the policy and market infrastructure ecosystem is constantly evolving (more below).
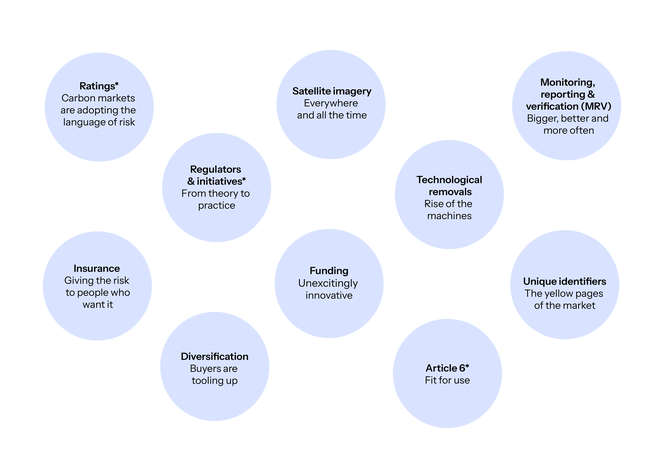
*expanded on in more detail in this article
Figure 7. Infographic outlining 10 innovations revolutionising carbon markets. Source: BeZero Carbon 2024. Full article here.
Flight to quality with rapid proliferation of regulatory development in carbon markets
In the last two years, there has been substantial activity in carbon market policy and regulation. Despite the lack of progress on how to implement Article 6 at the last COP, the first ITMO transfer was completed in January 2024. Many regional schemes have emerged in the last two years, focusing on challenges in both the supply side (quality) and demand side (claims). Highly influential market labels, such as the ICVCM’s Core Carbon Principles, have far more definition today than two years ago. International initiatives like the aviation sector’s CORSIA have moved beyond their pilot phase, bringing additional focus to the environmental integrity of carbon credits. Similarly, with greater expectations for companies both to account for climate related assets and liabilities as a balance sheet exercise and clearer guidance for how to use carbon credits as part of their climate activities, the policy backdrop makes for a more robust and mature market.
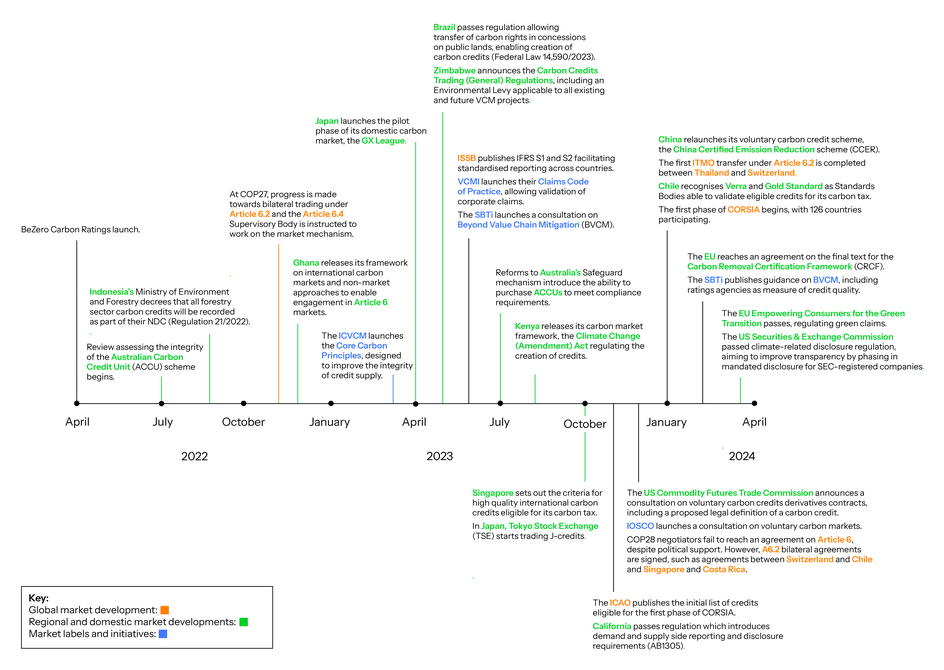
Figure 8: Timeline with a non-exhaustive list of regulatory developments and market initiatives between April 2022-March 2024, across different levels of carbon market activity and interaction.
Notes:
¹ Note that the analysis used to calculate these figures controlled for credit vintage.