Earth Observation in the BeZero Carbon Rating
Here are some key takeaways
Earth observation techniques, from spaceborne technologies to ground-level measurement, offer unique insights into assessing the quality of nature-based projects.
We find widespread applications across four risk factors in the BeZero Carbon Rating: additionality, over-crediting, non-permanence and leakage.
BeZero continues to invest heavily in building systems to curate and analyse satellite imagery, crossed with regional ground truthing, and robust geospatial frameworks for causal inference.
Contents
- Half a century of warming
- The BeZero Carbon Rating
- Earth observation in the BCR
- Knowing where to start
- Ratings integration
- Bespoke change detection
- Dynamic baselines
- Carbon stock density
- Conclusion
Please note that the content of this insight may contain references to our previous rating scale and associated rating definitions. You can find details of our updated rating scale, effective since March 13th 2023, here.
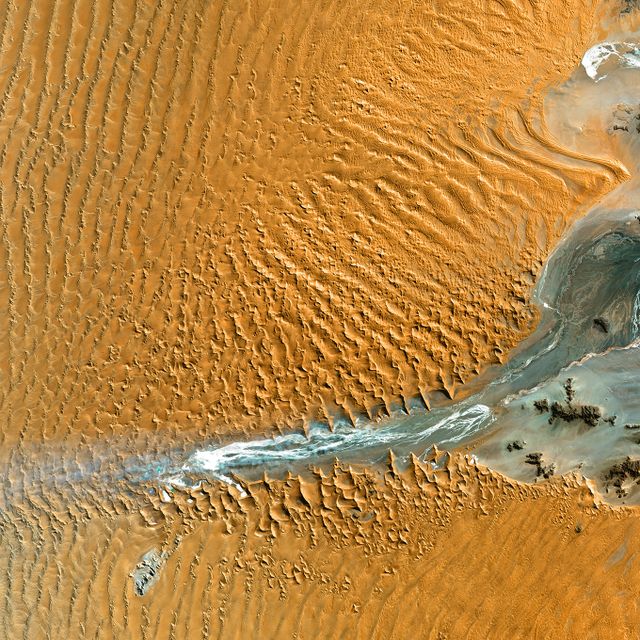
This month marks a milestone for earth observation. In July 1972, the Landsat program (originally Project EROS) launched its first satellite - now known as Landsat-1.
Fifty years on, the joint venture between NASA and the US Geological Survey provides the world’s longest continuous space-based record of the Earth’s land surface.
For nature-based projects in the Voluntary Carbon Market (VCM), Landsat has been widely used to provide low cost, medium resolution (15-60 m) imagery for project design and monitoring.
Data sources are diversifying, for example through ESA Sentinels and commercial providers. Furthermore, ambitions are growing to track carbon pixel by pixel, which requires active sensors (radar and lidar) together with the kinds of optical data provided by Landsat.
In April this year, BeZero Carbon launched the world’s first full service, global carbon ratings platform. Now, we are scaling the integration of earth observation, from Landsat missions to the latest technologies and geospatial insights, into our ratings framework.
Half a century of warming
As Landsat-1 launched, renowned meteorologist John Sawyer was penning an article for Nature magazine, arguing (somewhat tentatively, given the times) that human impacts on the global climate system were becoming too large to ignore.
Since then, atmospheric CO₂ has increased by 30% to 420 ppm, the highest concentration for several million years, while the global surface has warmed faster than during any other 50-year period in at least two millennia - in line with Sawyer’s predictions.

Image 1. The Keeling Curve, plotting 60 years of CO₂ accumulation in the Earth’s atmosphere. Credit: Scripps Institution of Oceanography.
Changes in global mean temperature mask large regional variations in the degree of warming, and especially in the frequency and severity of extreme weather events.
Each decade, events such as drought, flooding and heat stress are becoming more likely. The 2020’s are no exception. This month, wildfires raged across Europe, while infrastructure in Britain literally melted as the thermometer topped 40°C for the first time on record.
The urgency of action on climate change is now undeniable, and individuals, businesses, and governments are responding, committing to reducing, and offsetting, their climate impacts.
One consequence is a rocketing demand for credits in the VCM, while progress on Article 6 is opening the way for carbon credits to be traded between nations.
Whether at a project or country level, independent carbon ratings will play a crucial role in facilitating growth and trust in these emerging markets.
The BeZero Carbon Rating
The BeZero Carbon Rating (BCR) involves detailed assessment of six risk factors. In each case, we begin with a top-down analysis to identify specific risks pertinent to any given carbon project.
This is guided by a project’s location, policy environment, market sub-sector, and applied methodology, in combination with our in-house databases and experience of rating more than 250 projects (covering over half of the VCM’s total outstanding issuance).
The extent to which a project mitigates each of these risks determines the overall credit rating. This is a rigorous and lengthy investigation, involving expertise across myriad scientific, financial and policy domains.
Our ratings are reviewed as different types of evidence are brought to bear through sector-specific expertise and methodological advances, including satellite monitoring and geostatistical analysis.
Ratings represent our current opinion, and are subject to continual monitoring in light of new evidence entering (or prior evidence withdrawn from) the public domain.
Earth observation in the BCR
Among nature-based projects, earth observation can inform four risk factors: additionality, over-crediting, leakage and non-permanence.
Additionality is the risk that a credit purchased and retired does not lead to a tonne of CO₂e being avoided or removed that would not have otherwise happened. For example, if satellite monitoring corroborates high deforestation pressure, which an Avoided Deforestation project demonstrably alleviates, then credits could have low risk for additionality.
This risk factor is, however, fundamentally constrained by considerations beyond the scope of earth observation, and especially the financial viability of the project in the absence of carbon finance. Regardless of what we observe from space, if emissions reductions could have been viably achieved, in part or in whole, without income from carbon markets, then this imposes a ceiling on the additionality of corresponding credits.
A related concept is over-crediting, defined as the risk that more credits are issued by a project than tonnes of CO₂e avoided or removed. Over-crediting can arise due to inflated carbon stock estimates, unrealistic baseline assumptions, or because ex post emissions (i.e., emissions that have already occurred) are under-reported. Earth observation (from the ground, air and satellite) can help validate carbon stock densities, verify if changes in these stocks are accurately reported and, through geostatistical analysis, assess the realism of the baseline.
Similarly, earth observation techniques can help assess leakage risk, where emissions avoided or removed by a project are pushed outside the project boundary. Satellite data for instance can help detect if emissions are displaced to adjacent ecosystems (local leakage). The weighting of this evidence depends on how the project has accounted for and discounted leakage risk, both locally, and given potential for emissions to be displaced and dispersed to locations far away (market leakage).
Lastly, to mitigate non-permanence risk (reversal of emissions avoided or removed), nature-based projects typically contribute a portion of their issuance to a buffer pool, managed by the accreditor. In theory, if reversals occur then a corresponding number of credits are cancelled from the buffer.
Earth observation can partly inform whether buffer contributions are sufficient, given trends in land use, fire risk, flooding, and extreme weather events - in the project case, and collectively across all projects contributing to a pool. Our analysis of non-permanence risk is further informed by factors such as pests and disease, property rights, and whether local communities and wider governance are likely to be supportive of net GHG benefits throughout the commitment period.
To inform all these risk factors, we are building systems to curate and analyse satellite imagery, including from NASA, the European Space Agency (ESA), and other providers, in combination with on-the-ground measurements, and a wide array of satellite-derived, spatially modelled, and crowd-sourced data on environmental and socio-economic attributes relevant to project assessment.
Knowing where to start
Defining precisely which portion of the Earth’s surface is being managed to avoid or remove carbon emissions is an essential prerequisite for any spatial analysis.
Yet, it can be surprisingly difficult to obtain georeferenced boundaries for project areas, leakage belts and other regions pertinent to the assessment of nature-based carbon projects.

Image 2. Public availability of boundary data for 83 nature-based projects on the BeZero Carbon Markets platform. Many project areas, and the majority of leakage belts and reference regions (where applicable) require in-house correction or creation by BeZero, while some cannot be reconstructed from publicly available data.
Where available, we cross-check georeferenced boundaries against project design documents (visually and by area) and monitoring reports (to check if boundaries have changed over time).
For around half of the project areas on our platform, georeferenced boundary data are simply missing from the registries, while the majority of leakage belts and reference regions are also missing. In these cases, it can take considerable time and expertise to recreate the boundaries, georeferencing from project documents, satellite imagery and other public data.
For subscribers to our platform, georeferenced boundaries will allow exploration of project regions in the context of satellite imagery, governance, infrastructure and biodiversity.
For our team, they are the starting point for much deeper geospatial analysis.
Ratings integration
Since our platform launch in April, we have been using geospatial data, including satellite imagery, to inform our ratings in cases where a project’s accounting or methodology has raised particular concerns.
We have included analysis of, for example, forest cover change, vegetation greening, suitability for agriculture, accessibility and governance, and fire history.
Now, with much increased capacity and fantastic expertise recruited to our team (decades of collective experience at top space agencies, universities and the private sector), we are scaling these analyses and standardising integration with our ratings framework.
In the first instance, we will provide historical context and ongoing satellite-derived and crowd-sourced monitoring for all nature-based projects. As outlined earlier, this evidence will supplement the wider investigations of project methodology, finance and policy that we routinely assess in our ratings.

Image 3. Example landscape showing an uptick in fire activity following the project start date in 2016. We use state of the art burned area (left axis, MCD64A1 collection 6) and fire detection (right axis, VNP14IMGML) data developed by NASA. Burned area captures the extent of burning, while active fire detections reflect the count of hot pixels at satellite overpass (a measure directly related to carbon emissions). Project-level accuracy assessment is provided by comparison against higher resolution datasets derived from Landsat and Sentinel-2.
Meanwhile, we are advancing our earth observation and geospatial methodologies, by biome and market sector. Our objectives are to: (1) detect ecosystem change with greater accuracy and more nuance, within known bounds of confidence; (2) rigorously distinguish observed change from business as usual, using dynamic baselines; (3) systematically refine our assessment of carbon stock densities.
Bespoke change detection
The lowest hanging fruit for change detection is Avoided Deforestation in the wet tropics. For dense, evergreen forests, Landsat-derived forest change maps are readily available from Global Forest Watch and the European Commission’s Tropical Moist Forest Explorer.
Judicious use of these datasets can be extremely helpful. But, like most global products, there are tradeoffs in local accuracy at any given site.
Robust, project-level monitoring requires locally tailored processing of the underlying satellite imagery, locally generated labels for training and validating machine learning algorithms, and analyst oversight to ensure that uncertainties are reliably quantified.
At BeZero, we are building these project-level solutions, harmonising data across Landsat missions, combined with more recent 10-20 m data from ESA Sentinels, and height estimates from the Global Ecosystem Dynamics Investigation lidar instrument.

Image 4. Forest maps for change detection. Left: dry season satellite imagery for a REDD+ project in Cambodia (boundary in orange, dense evergreen forest in dark green). Centre: Global Forest Watch overestimates forest extent (yellow). Right: BeZero’s models are locally trained and validated to more accurately identify the relevant forest type (blue). Inset shows agricultural land / plantation, included as forest by the global product but not by our in-house machine learning.
These kinds of maps are not appropriate for all forest types, however. Definitions vary, but ecosystems with at least 10% tree canopy cover are potentially considered forest.
Across the world, large extents of seasonally dry, open forest are subject to high rates of loss, releasing substantial amounts of carbon from the dense wood of fire-adapted trees, and from the soils they stabilise.
The more open and seasonal the forest, the more likely it is to be excluded from (or missed by) global monitoring systems. Moreover, where the dominant forest type is characterised by large variations in canopy cover, ‘deforestation’ as a concept becomes altogether less useful as a measure of carbon emissions. Similarly, even in dense forests, degradation (cf. clear cut) may be missed by binary forest / non-forest classifications.
Our research in this area is focused on deep learning methods, trained on very high resolution imagery, to detect individual trees and sub-pixel changes in canopy cover.
Across a wider range of ecosystems, we are developing methods to monitor change through seasonal patterns in vegetation structure and reflectance, for example to detect greening as a result of afforestation or forest restoration, or to assess grazing impacts in grasslands.
Dynamic baselines
Ecosystems are continually changing in their composition, structure and extent. With or without carbon projects, nature and anthropogenic pressures are dynamic.
Regardless of our ability to observe change with greater or lesser precision, a potentially greater source of uncertainty lies in what cannot be observed at all - the baseline (without project) scenario, against which ex post emissions are later compared to determine issuance.
For nature-based projects, this comparison is part observation (project monitoring) and part blind faith (no one has the counterfactual data to test against).
This challenge is not unique to the VCM. In the medical and conservation sciences, statistical frameworks have been developed for inferring the causal impact of an intervention (a new drug or a nature reserve) in situations where randomised controlled trials are unethical or impractical.
At BeZero, we are adapting these frameworks for application in the VCM, to assess the realism of project baselines and leakage assumptions.
Our approach is to statistically match ‘treatment’ pixels in the carbon project area with control pixels in the wider landscape. Matching accounts for ecosystem characteristics, as well as predictors of change (accessibility, governance, suitability for agriculture, and so on).
We then use earth observation to track what happens inside the project area (changes in forest cover, vegetation greenness, disturbance events - ultimately carbon) and compare with the matched controls where there is no carbon project.
An important aspect is understanding the limitations of data used for matching, and how to combine these to parsimoniously capture pressure on ecosystems. Matching will always be imperfect, however, and so we randomise and repeat the process to assess uncertainty.
Unlike traditional baselines, this approach is dynamic: both treatment and control are subject, in real time, to the same exogenous influences on land use and ecosystem change (commodity prices, political influence, weather events). Moreover, the context for controls can be monitored and updated, ensuring that matching remains robust though time.
Dynamic baselines will add further depth to our existing analysis of project assumptions, applied in the context of what a credit is actually claiming to deliver, given the calculations backing each vintage as detailed in monitoring reports.
Carbon stock density
Landsat-1 provided revolutionary insights about global land cover in the 1970’s, and space agencies like NASA and ESA continue to push the frontier.
Lidar instruments onboard the International Space Station (ISS) and the Ice, Cloud and land Elevation Satellite (ICESat-2) provide 3D characterisation of forest structure. Next year, ESA will launch its BIOMASS mission, using P band Synthetic Aperture Radar (SAR) to help map carbon in even the densest forests.
Nevertheless, mapping carbon stocks from space remains a huge challenge, and considerable ground data are required for model calibration and to understand the error in prediction. Carbon stock densities may be mapped at high (e.g. 10 m) spatial resolution, but this is usually false precision.
Given uncertainties in global and regional carbon maps, project developers should use a combination of targeted field observation and remote sensing to measure and upscale their stock estimates.
At BeZero, we assess which carbon pools are accounted for, how these are measured in the field, methods for allometry and upscaling, how uncertainties are calculated and discounted, assumptions regarding residence times of carbon in wood products, estimates for lagged accumulation or release of carbon from belowground stocks, and so on.
For comparison, we consider where the reported stock densities sit within the wider distribution of what is known from similar ecosystems in the region, informed by our database of primary field data, literature review, and remote sensing.
Meanwhile, we invest in regional ground monitoring, collecting new field data required for calibrating and validating our in-house models. These data enable us to critically evaluate existing field-based approaches and contribute to the next generation of satellite-derived carbon maps.
Conclusion
Today’s VCM is just the latest in a string of use cases for earth observation techniques dating back over half a century. The level of investment and innovation, from project development and accreditation to carbon ratings agencies, is extremely encouraging.
For BeZero, this means understanding the opportunities and limitations these approaches represent across our coverage of nature-based projects.