
BeZero’s carbon risk factor series: Over-crediting
Here are some key takeaways:
Over-crediting assesses the core building blocks of a carbon project’s credit issuance, interrogating how appropriate the calculations and assumptions are.
It represents an essential pillar of the BCR framework, reflecting the importance of accurate issuance calculations to a credit’s carbon efficacy.
We find Nature Based Solutions (NBS) face higher over-crediting risks than non-NBS projects on average, reflecting higher uncertainties and divergent methodologies.
Contents
- What is Over-crediting?
- Issuance calculations: Composition
- Credit Issuance Calculations: Parameters
- Over-Crediting Risks Across the BCR Universe
- Project-Specific, Bottom-Up Analyses of Over-Crediting
- Conclusion
What is Over-crediting?
Over-crediting is “the risk that more credits than tonnes of CO₂e achieved are issued by a given project” due to factors such as unrealistic baseline assumptions or employing data with large uncertainties.
Accurate credit issuance is crucial for a project’s integrity. Indeed, assessing integrity around credit issuance requires transparency around how issuance is calculated through the identification of the most plausible baseline scenario, as well as estimates of the carbon stocks in both the baseline and project scenarios.
This piece discusses the key factors which can lead to over-crediting and their interaction with the BeZero Carbon Rating (BCR), through examples of the ~370 projects currently rated.
Issuance calculations: Composition
BeZero’s assessment of over-crediting is driven by the accuracy and appropriateness of each of the four components of credit calculation: baseline carbon stocks, project carbon stocks, leakage emissions and non-permanence deductions. For this reason, a project must provide sufficient publicly available information regarding each component for ex-post vintages in order to be eligible for a BCR. More information on the importance of sustained information provision is available here.
The relative contribution of each of the four components toward credit calculations depends on the project type. For many projects in the Voluntary Carbon Market (VCM) which conduct avoidance activities (responsible for almost 90% of currently outstanding credits), the baseline assumptions are the primary driver. Within these project types, technology-based interventions often assume zero project and leakage emissions, and risk buffers are not placed into a global pool.
Meanwhile, credit issuance for NBS such as avoided deforestation relies on all four components, given the risk of non-permanence and leakage typically associated with them. For removals projects, accurate project carbon stock estimates are crucial for ensuring that the correct number of credits is issued.
Such variability in the composition of credit calculations requires bespoke assessments of over-crediting, which take into account both top-down sectoral and national trends, and bottom-up project specifics.
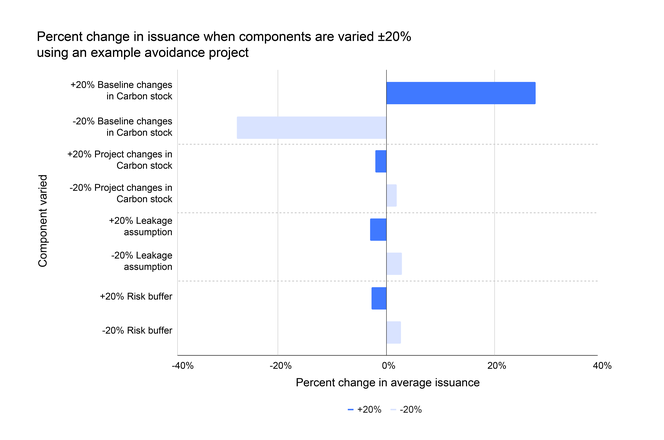
Chart 1: An example demonstrating how a ± 20% change to each component of emission reduction calculations affects total credit issuance for an avoidance project (this example uses an avoided peat conversion project).
Our analysis shows that variations in the baseline calculations can have a significant impact on the number of credits issued for avoidance projects. In the example shown in Chart 1, a ± 20% variation in the baseline results in a proportionately greater change in issuance.
Project carbon stock changes have a relatively minor impact on issuance as the project is avoiding emissions rather than removing carbon. Instead, for avoidance activities, this represents emissions generated by setting up and maintaining a project, e.g. off-grid electricity generation or equipment fuel usage.
While the leakage contribution for the project shown in the example in Chart 1 is relatively small, this can vary significantly from project to project. Leakage tends to vary from 0% of issuance for Energy projects to 40% of issuance for NBS avoidance projects meaning on average variations have a proportionately smaller impact on total issuance.
We find risk buffer contributions to average 13% of issuance for NBS avoidance projects. Given the risk buffer is calculated as a percentage of total issuance, variations will always have a proportionately smaller impact on issuance.
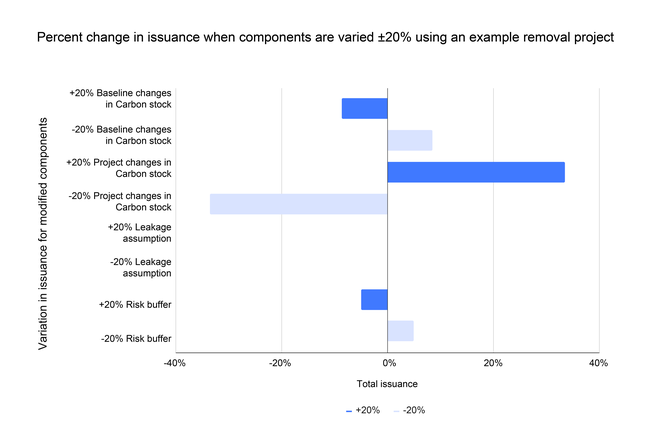
Chart 2: An example demonstrating how a change of ± 20% to each component of credit calculations affects overall issuance for removals projects (this example uses an Afforestation, Reforestation & Restoration (ARR) project).
The largest contributing component to issuance calculations for removals projects is the change in project carbon stocks. Chart 2 shows that for our example project, variations in the changes in carbon stocks have a proportionately larger impact on issuance.
Many removals projects assume a baseline of relatively small to zero changes in the carbon stocks. This results in proportionately less variation in issuance when the baseline is varied, particularly when comparing to avoidance projects.
In the example used in Chart 2 leakage is assumed to be zero so percentage variations have no impact on issuance. Similarly to avoidance projects, leakage as a percentage of total issuance tends to be relatively small meaning variations have a proportionately lower impact.
We find risk buffer contributions to average 11% of issuance for NBS removal projects. Like avoidance projects, where a risk buffer is applied it is calculated as a percentage of total issuance. This means variations will always have a proportionately smaller impact on issuance.
Credit Issuance Calculations: Parameters
In addition to the varying composition of credit calculations, assessing over-crediting risks requires different information for different sectors. This is because the data underlying baseline calculations vary between project types.
For NBS projects, key parameters include the carbon pools which are included in project and baseline calculations, the robustness of baseline assumptions and whether applied data are species-specific or default. These allow the accuracy of the project’s calculated carbon stock to be gauged.
Meanwhile, in other sectors such as Renewable Energy, emissions reduction calculations are estimated by simply deducting project emissions from baseline emissions. Since baseline emissions are in part determined by the grid emission factor, whether a project employs static or dynamic emission factors is an important consideration for such initiatives.
The full extent of the necessary parameters to assess is contingent on a project’s specific sub-sector. A simple sector syntax is available here, while some of the key considerations for the main sector groups are presented in Table 1.
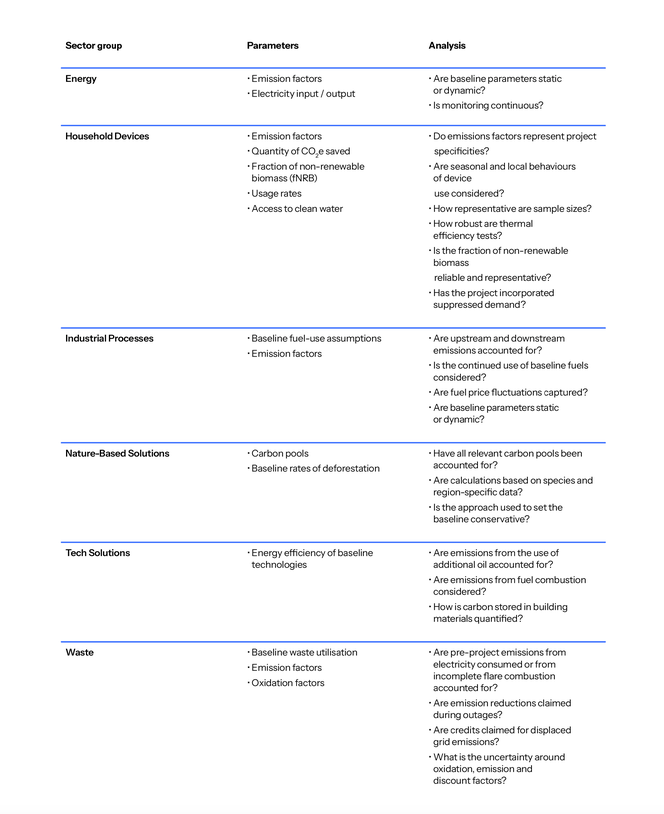
Table 1: Key parameters required to calculate credit issuance across the six sector groups. Note that this is not an exhaustive list.
Over-Crediting Risks Across the BCR Universe
Across the VCM we find over-crediting risks to be driven by disparate data uncertainties, rigour in monitoring and sample sizes. We score these risks across four buckets: significant risk; notable risk; some risk and little risk.
Chart 3 shows the distribution of over-crediting risks within each of our six sector groups. Across our database of 370+ rated projects, we find that Energy projects face the lowest risks of over-crediting. Household Devices demonstrate the highest over-crediting risks while NBS exhibits most variability.
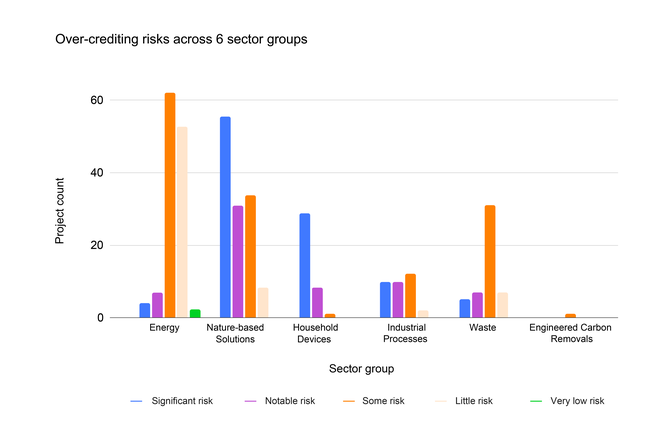
Chart 3: An analysis of over-crediting risks across the main sector groups within the BeZero universe demonstrates that both, within and across sector groups, risks are variable and are evaluated across at least three of the four risk levels.
The low levels of risk associated with Energy projects is largely owed to the continuous monitoring of baseline parameters.
Significant or notable risks of over-crediting are observed for projects within the Household Devices because the methods for setting the baseline are not standardised, and the applied thermal efficiency tests have varying degrees of accuracy. Capturing usage rates for such projects is also difficult due to logistical issues associated with monitoring sparse populations.
Variation in NBS projects is largely driven by divergent methods for baseline setting and the inherent difficulty of determining a counterfactual.
To provide a more granular view, we take a look at the varying levels of risk for the top ten largest sub-sectors by credits outstanding. Those with the lowest risk are Hydro, Wind, Solar and Peatlands as highlighted in Chart 4. This low risk is driven by conservative baseline parameters such as comprehensive accounting and using project-specific data. In the case of very low risk projects for Hydro and Wind this is also true, but in some cases, they have shown potential for under-crediting which reduces any risk further. Sub-sectors where continuous monitoring is possible enables more accurate accounting which tends to decrease inherent risks.
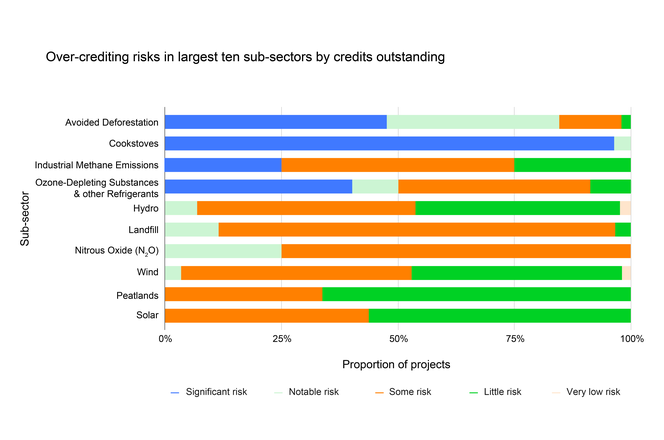
Chart 4: A breakdown of the observed levels of over-crediting risk within the top ten sub-sectors in terms of credits outstanding within the BeZero Carbon universe demonstrates that lower over-crediting risks are observed within Landfill Gas and Renewables projects in comparison to sub-sectors such as Cookstoves or Improved Forest Management (IFM).
Cookstoves and Improved Forestry Management exhibit the highest risks, while Avoided Deforestation projects are the most variable.
This again highlights the prevalence of data uncertainties for Cookstoves initiatives and the lack of standardisation when it comes to baseline setting across IFM and Avoided Deforestation projects.
Such inconsistencies in the accuracy of issuance calculations demand that assessments of over-crediting incorporate both sectoral trends and project-level risk analysis.
Project-Specific, Bottom-Up Analyses of Over-Crediting
To illustrate a few of the considerations made to assess over-crediting risks, we take a look at examples of projects which have both, high and low risks across the BeZero Carbon Rating universe. The purpose of these case studies is to demonstrate how different approaches to credit issuance can create varying degrees of over-crediting risks according to the BeZero Carbon Rating framework.
Avoided deforestation: risks vary within the sub-sector
Variation in over-crediting risks within Avoided Deforestation are driven by the multiple methods for determining a counterfactual scenario and the difficulties each of these face. Of the 36 projects assessed within the sub-sector, 10 hold significant risks, 12 have moderate risks and 14 have some risks (Chart 5). This reflects the difficulty in baseline setting and the resultant variability within the sub-sector, relative to another sub-sector like ARR where nearly 90% of rated projects are deemed to have some risks. Such uncertainties emphasise the need for tailored, bottom-up assessments of projects within the sub-sector.
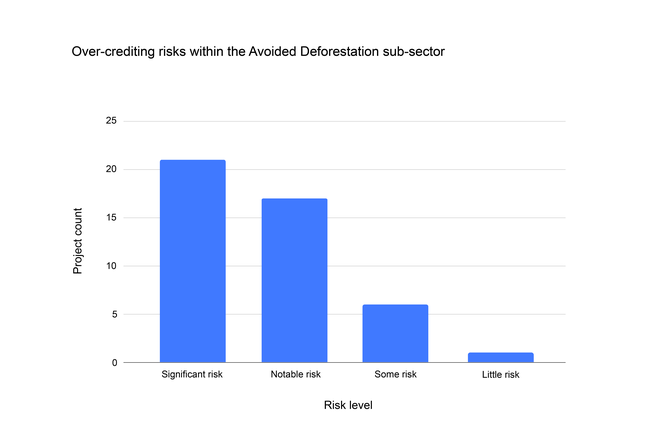
Chart 5: Observed over-crediting risks within the sub-sector, Avoided Deforestation highlight a wide spread of risks with the caveat that no projects are deemed to have little risk. This is owed to the variety of possible approaches to setting a counterfactual baseline scenario, and underlines the need for project-specific assessments.
We pick two Latin American Avoided Deforestation projects to highlight these differences in over-crediting risks. The first, based in Brazil, holds significant over-crediting risks due to the application of an inflated baseline. Conversely, another Avoided Deforestation initiative in Peru is associated with lower risks of over-crediting by employing a representative historical reference period and setting a conservative baseline.
Accurate baseline setting is critical to the robustness of Avoided Deforestation credits given variations can have such a large impact on credit issuance. For the first project in Brazil, we find that instead of using historical deforestation rates in the region to set its baseline through a time-function approach, the project used a modelling approach which employs stochastic techniques to predict sequences of events to estimate future rates. By doing this, the established baseline deforestation rates were 22% higher than those observed historically in the region (Chart 6). If the reference area trend was used, this would have been 8%. To illustrate how this impacts accounting, the employed approach gives rise to 13% more credits being issued compared to adopting a historical baseline, while this is 10% for the reference area baseline scenario. This represents a significant over-crediting risk, and demonstrates how such an inflated baseline raises the likelihood of inaccurate credit calculations and disproportionate issuance.
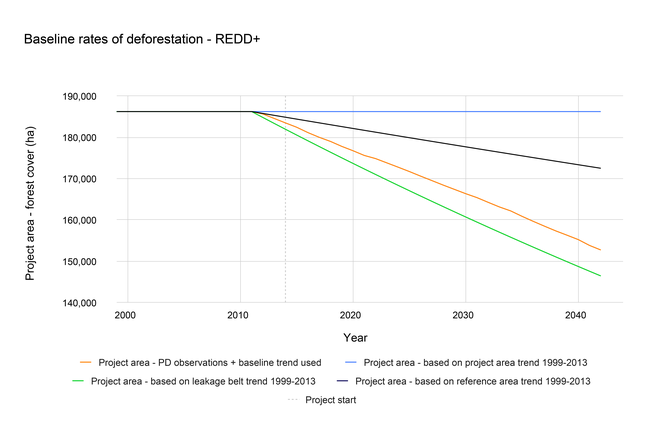
Chart 6. An analysis of the potential baseline rates of deforestation that could be applied by a Brazilian Avoided Deforestation project indicates that the chosen modelling scenario is inflated and creates a significant over-crediting risk. The adopted approach assumes a significantly higher rate of deforestation than what is historically observed.
In contrast, a Peruvian Avoided Deforestation project calculated its baseline using a historical reference period with a reference region which had representative biophysical characteristics. These included infrastructure development, the movement of local stakeholders and the composition of vegetation. By employing this time-function approach, the project’s baseline estimates were calculated using data which was more representative to the reality on the ground and thus raises the accuracy of credit issuance. This produces lower over-crediting risks than forecasting future deforestation, due to the inherent uncertainties tied to predicting land-use changes in the region.
Improved Forestry Management: inherent risks
Improved Forestry Management (IFM) also requires close examination of baseline setting given the influence of the counterfactual scenario on credit issuance. Similarly to Avoided Deforestation, the lack of a standardised approach has given rise to significant variability in how IFM baselines are set, with no singular pattern for the sub-sector. However, unlike Avoided Deforestation we observe high over-crediting risks more consistently across IFM projects, with 15 out of 15 projects analysed holding significant or notable risks.
Chart 7 shows a Canadian IFM project with significant over-crediting risks. The project assumes that in its absence, the region would have been subject to a market-driven logging scenario with a 15-year depletion rate harvesting regime. We find limited evidence to support this and no available data on other bidders for project property. This uncertainty is augmented by reports of previous interest to maintain the forest, with sale of the project area limited to offers from stakeholders with such interests.
The decision to adopt a baseline scenario with the highest possible harvest rates leads to a far larger amount of credits issued than alternative approaches. In this case, a more accurate approach would be to adopt either a historical baseline or a sustained yield approach as the baseline scenario, with more conservative harvest assumptions and thus lower likelihood of over-crediting.
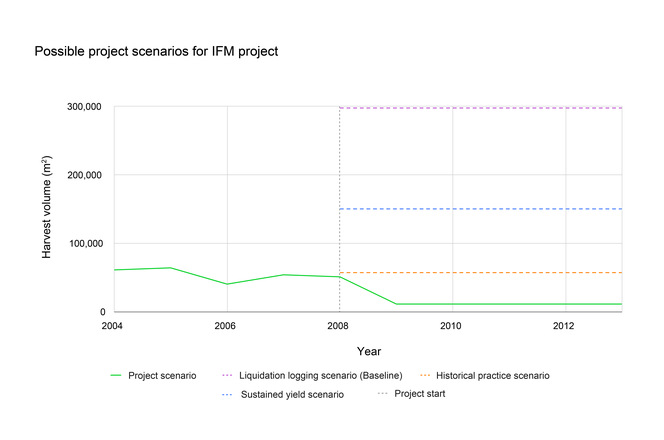
Chart 7: The possible project scenarios for an IFM project. Out of three possible scenarios, with the historical baseline being the most accurate, the liquidation scenario was chosen which has the highest harvest volume. This generates more credits than the most likely baseline scenario.
Non-NBS: Lower risks
We find that non-NBS projects typically have lower over-crediting risks. In fact, 62% of such projects are assessed to have little or some over-crediting risks within the BCR universe, compared to 49% for NBS projects.
For Energy projects, which make up 66% of non-NBS projects within the BCR universe, credit issuance calculations are driven by electricity input/output and the emission factor used to convert it to carbon estimates. This combined with how the project is monitored on an ongoing basis drives the over-crediting risk.
Given Energy projects are supplying the power they generate, either locally or to a grid, measuring this output with a high degree of accuracy is easier than for NBS projects where tracking trees or other biomass changes requires more technological and skilled resources. The potential inaccuracies for Energy projects often comes from the emission factor used in the counterfactual scenario, i.e. what emissions would have been caused if this power were generated elsewhere.
The use of a dynamic emission factor - instead of a static one which is fixed at the start of the crediting period - acts to ensure that the baseline is as accurate as possible, and thus negates any risks of issuing more credits than it should.
We explore two examples of this; Chart 8 shows the static baseline used by a hydropower project in India. Where a static baseline has been applied, our analysis shows that the grid emissions factor has fallen by 8% from 2013 to the latest data for 2021. This has led to c. 10,000 more credits being issued than would have been the case were a dynamic baseline to be applied.
Chart 9 shows a dynamic baseline used by another Indian hydropower project. The project reports a 6% drop in the applied emission factor between 2013 and 2018. Although this is less than the 8% decrease we find from the national grid data, it is more closely aligned than if a static baseline had been used and results in c. 6000 fewer credits being issued.
Despite the tendency for energy projects to continuously monitor electricity use and generation, the different available options for projects to apply emission factors reiterate the need for tailored, project-specific assessments of over-crediting risks.
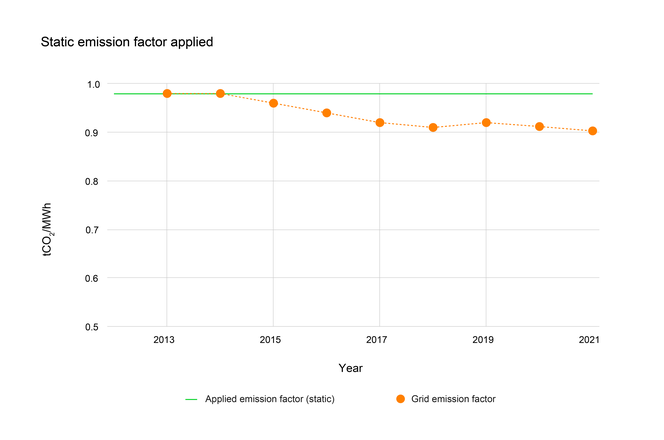
Chart 8: A static emission factor deviates from the grid emission factor over the course of a project’s crediting period. With this applied emission factor, credit issuance calculations are based on values which are outdated and raise the likelihood of over-crediting.
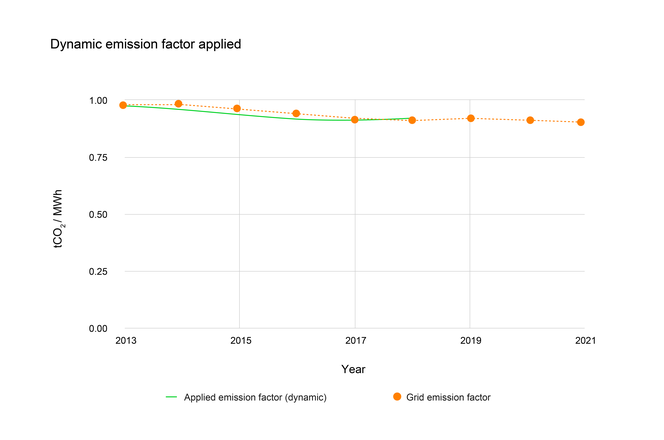
Chart 9: This shows how the application of a dynamic emission factor is largely aligned with the grid emission factor, allowing for more accurate credit issuance calculations.
Conclusion
A carbon credit’s degree of carbon efficacy is highly reliant on the elements which contribute to credit issuance. This is why robust reporting on a project's issuance calculations is vital for achieving accreditation, and an essential focus area within the BeZero Carbon Rating framework.
A project’s sub-sector determines both the components which are relevant to credit calculations and the necessary parameters for evaluating accuracy, which vary significantly. BeZero's analysis demonstrates the broad trend of non-NBS projects holding generally lower risks, while more variable risk degrees are common among NBS initiatives.
Given the plethora of moving parts involved in credit calculations, for all projects regardless of sector it is vital that assessments are bespoke and incorporate both top-down and bottom-up analysis.