
BeZero’s carbon risk factor series: Leakage
Here are some key takeaways
Leakage is the risk that the carbon avoided or removed by a project is pushed beyond its boundaries, thereby undermining the degree of carbon efficacy. The two sources of leakage are market leakage and activity displacement.
BeZero assesses leakage by interrogating the extent of possible risks, including those associated with activity within and around a project area, as well as any safeguards put in place to mitigate such risks.
We find that Nature-Based Solutions (NBS) projects generally hold higher risks of leakage than those under non-NBS.
Contents
- What is leakage?
- Key factors when assessing Leakage risks
- Leakage requirements across the VCM
- Mapping Leakage in the BCR universe
- Project-specific examples
- Conclusion
Please note that the content of this insight may contain references to our previous rating scale and associated rating definitions. You can find details of our updated rating scale, effective since March 13th 2023, here.
What is leakage?
Leakage is “the risk that emissions avoided or removed by a project are pushed outside the project boundary”. The sources of such emissions vary from sector to sector, however, they can be broadly categorised into two: market leakage and activity displacement.
Market leakage occurs when a project’s activities alter the supply and demand equilibrium, shifting market dynamics such that emissions avoided or removed by a project are offset by market activities elsewhere. Meanwhile, activity displacement refers to a specific emitting activity being displaced more locally.
Taking Improved Forest Management (IFM) as an example, these projects increase carbon stocks by enforcing a more conservative harvest than the modelled baseline scenario. This results in a reduced supply of timber, demand for which needs to be met from elsewhere. When that demand is met from other sources in proximity to the project, this is called activity displacement. Where reduced supply is met from the wider market, this is defined as market leakage.
Both market leakage and activity displacement are unintended consequences which can undermine the carbon benefits of a project. It is vital that project developers anticipate, monitor and mitigate risks to ensure that each credit delivers a full tonne of CO₂e avoided or removed.
The importance of leakage in determining carbon credit quality is reflected by it receiving the third-highest weighting within the BeZero Carbon Ratings (BCR) framework, alongside non-permanence.
This piece discusses the key factors which determine leakage risks across the Voluntary Carbon Market (VCM), including its components and possible safeguards, and how they vary across sectors. It then explores how these considerations relate to the BCR, through examples drawn from more than 250 projects currently rated.
Key factors when assessing Leakage risks
To break down our assessment of leakage risks and safeguards, we lay out the primary considerations and how these differ between sectors.
1. Components and safeguards: NBS
1a. Components
NBS projects are exposed to both market leakage and activity displacement. Market leakage can emanate, for example, from national or global demand for timber supplies. If a project’s activities raise the supply of a certain type of timber in an area where demand is relatively low, such as through the establishment of sustainable plantations, leakage may arise in the form of export emissions.
Meanwhile, an example of activity displacement can occur when an Afforestation, Reforestation & Restoration (ARR) project is in an area historically used for cattle grazing, an agricultural practice associated with methane emissions. This can lead to such activities being displaced beyond the project’s boundary, thus introducing leakage risks.
It is also important to note that positive leakage can occur, such as when a project’s activities lead to a growth in carbon stocks beyond its boundaries. An example of this is when the management of sustainable woodlots leads to continued growth of carbon stocks outside of a project, acting to mitigate negative leakage.
There is variation in how projects account for leakage, if at all. If risks are deemed to be negligible, leakage is assumed to be zero. Chart 1 highlights such disparities within NBS sub-sectors.
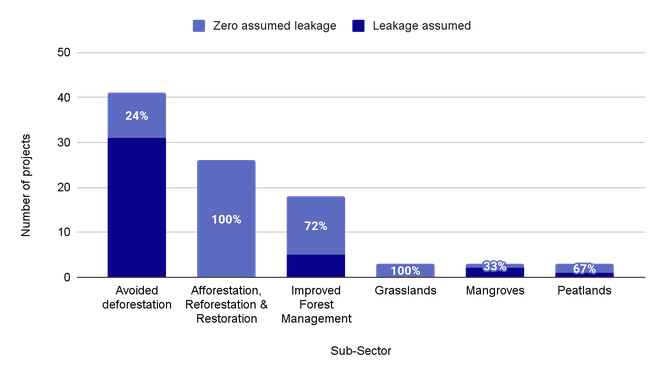
Chart 1: Analysis of leakage assumptions across the sub-sectors within NBS highlights variation in how leakage is accounted for, with assumptions of zero ranging from 100% within ARR and Grasslands to 24% for Avoided Deforestation.
In line with the BCR framework, we consider risks arising from both a top-down and bottom-up perspective. For the former, this involves consideration of global and national data on parameters such as timber supply and demand. The latter pertains to the interrogation of project-specific information on factors, such as historic land-use in the area.
This hybrid approach ensures as broad a range of sources as possible of potential leakage risks are considered and accounted for in the rating.
1b. Safeguards
Once potential leakage sources are identified, we interrogate any safeguards employed by the project. Possible safeguards include leakage belts, dedication of leakage allocations and the development of alternative livelihoods, among others.
Within Avoided Deforestation projects, a key consideration is the appropriateness of the employed leakage belt. A leakage belt is a parcel of land surrounding or adjacent to a project area which is supposed to represent an area at risk of activity displacement and resulting emissions in the region, and makes up one component of issuance calculations for relevant projects. The suitability of a leakage belt is contingent on whether it accounts for accurate drivers and rates of deforestation.
Another key safeguard within NBS projects is the use of a discount factor to mitigate risks of market leakage. A discount factor is applied to the net emission reductions achieved by the project annually, or to a portion of such reductions in the case of IFM projects. Its degree of suitability can be inferred by comparing the employed value to other estimates of leakage rates in a project’s region, whether our own in-house estimates or those from peer-reviewed literature. One example of our internal databases is for Chinese IFM projects under VCS, for which we go beyond single project requirements to assess national-level leakage risks for projects attached to this single registry.
2. Components and safeguards: Non-NBS
2a. Components
In general, non-NBS projects typically face negligible risks of activity displacement. This is because upstream emissions associated with infrastructure acquisition and construction for such projects tend to be small relative to the carbon savings over the project lifetime.
Cookstove projects are the exception, with risks of leakage emanating from the use of traditional stoves for space heating and/or smoke for insect repellent.
Assessments of leakage for non-NBS projects are based primarily on the incidence of market leakage. For example, renewable energy projects often assume leakage to be zero. However in regions with high renewables penetration, growing use of renewable energy can result in lower fossil fuel prices as demand drops for traditional energy inputs. This may lead to project leakage at a country level if lower prices for fossil fuels stimulate demand in other energy-intensive sectors, e.g. transport. This is known as the rebound effect.
2b. Safeguards
As for safeguards, non-NBS projects can also apply discount factors. Similarly to NBS projects, assessing the appropriateness of such measures requires the applied value to be corroborated with top-down values which are indicative of the degree of risk. For example, monitoring of cookstove usage rates can also be conducted to gauge the extent of high-emitting stoves being displaced as previously described, with the adopted approach also interrogated as part of our analysis.
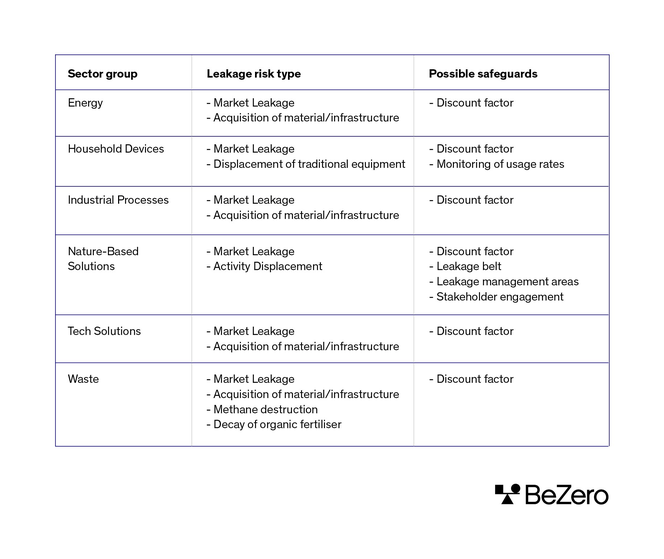
Table 1: A list of the typical sources of leakage risks and possible safeguards across the main sector groups. Note this list is not exhaustive.
Leakage requirements across the VCM
The VCM’s major registries typically determine accounting requirements for leakage at a methodological level, with similarities and variation across different accreditors.
For example, for many cookstove projects, both Verified Carbon Standard (VCS) and Gold Standard (GS) require the use of a 0.95 discount factor to emissions reduction calculations. This means that for every 100 tonnes avoided by the introduction of improved cookstoves, the discounting applied in the project’s carbon accounting leads to 95 credits issued.
Disclosures around leakage requirements for American Carbon Registry (ACR) and Climate Action Reserve (CAR) are less transparent. The former notes how project developers must account for certain types of leakage according to methodological requirements, while the latter does not require explicit accounting for leakage emissions.
Mapping Leakage in the BCR universe
Across the VCM, the degree of leakage risk depends on the likelihood of market leakage and activity displacement occurring, as well as the suitability of employed safeguards. We reflect the varying degrees of risk using the following language, from highest risk to lowest risk: significant risk, notable risk, some risk and little risk.
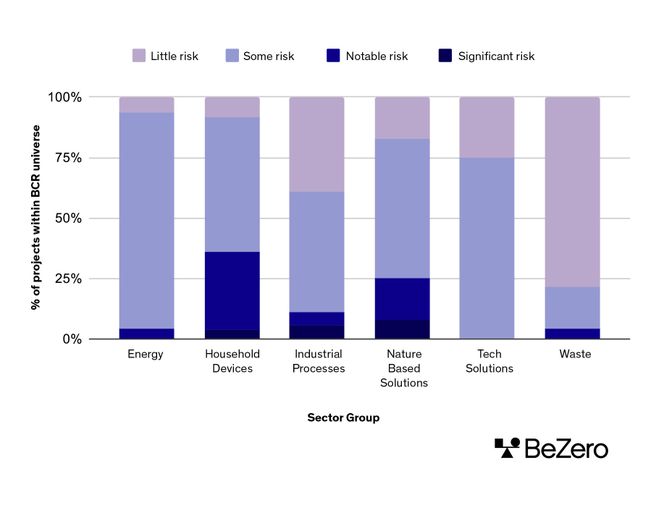
Chart 2: Analysis of leakage risk levels by sector group highlights how projects within NBS and Household Devices generally hold the highest leakage risks.
A key insight from our universe of rated projects is that NBS projects typically hold higher leakage risks than non-NBS initiatives, with the exception of Household Devices.
We find NBS projects’ leakage risks arise from a variety of sources across both market dynamics and activity displacement. Comparatively, many non-NBS projects largely face minimal leakage risks from activity displacement.
We also find:
The sector groups with the lowest leakage risks are Industrial Processes, Tech Solutions and Waste. This is because 75% of projects within these sector groups are deemed to have some or little risk.
Projects within Household Devices and NBS hold the highest risks, a large proportion of projects in these sector groups hold either significant or notable risks, at 36% and 25% respectively.
For Household Devices, this is likely due to the likelihood of traditional cookstoves being re-used beyond a project’s boundary. Meanwhile, NBS projects are exposed to both types of leakage and variations in the application of leakage belts, as well as in how deforestation is tracked and accounted for.
In general, non-NBS projects face the lowest risks. This is likely due to the largely negligible risks of activity displacement associated with such projects, while market leakage is only likely to occur in areas with high penetration of a project’s employed technology. This is consistent with many non-NBS projects assuming leakage to be zero.
Project-specific examples
To provide a more granular insight into how leakage risks are determined, we now take a look at some project-specific examples illustrating both high and low risk projects in the BCR universe.
1. Case study: Project with “Some Leakage Risks” within NBS
We find some leakage risks for a Brazilian Avoided Deforestation project. Although the project identifies and estimates both sources of leakage in line with the VCS methodology, considerable risks arising from its carbon accounting remain.
The project’s monitoring reports reveal emissions three times higher in the leakage belt than predicted by the project ex-ante. However, leakage is assumed to be zero during emission accountancy by attributing the activity to municipal expansion rather than project activities.
In order to estimate the validity of the project’s zero leakage assumptions, our Earth Observation (EO) analysis evaluates the drivers and rates of deforestation. The team observed that ~1762ha of deforestation occurred annually in all parts of the leakage belt during the monitoring period. In fact, around 33% occurred within 10 km from the project boundary and away from the municipality.
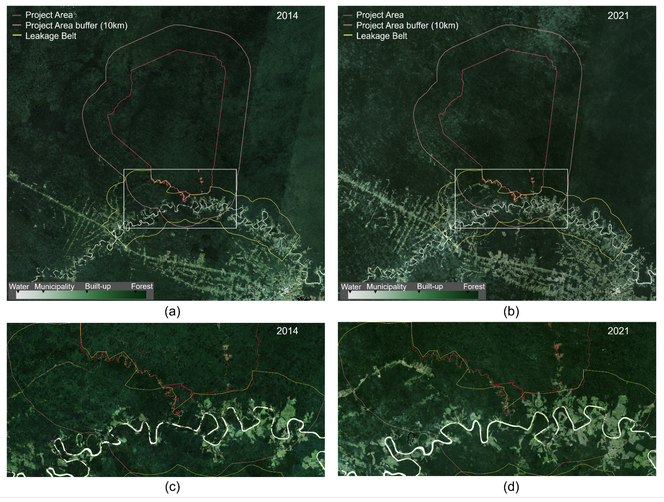
Figure 1: Satellite imagery of the project area, project area buffer (10 km) and the leakage belt for a Brazilian Avoided Deforestation project.
Looking at Figure 1, our EO analysis highlights the observed deforestation occurring in the leakage belt, with (a) and (c) depicting the state of the area at the beginning of 2014, and (b) and (d) at the end of 2021. These images demonstrate that almost 33% of the deforestation (coloured light green) which occurred during this period was located within 10 km of the project boundary, and away from municipal expansion which is observable at the bottom-right in (a) and (b). This subverts the project’s claim that its leakage emissions were zero during the monitoring period.
These data demonstrate that project leakage reporting is likely inadequate. It poses risks to the project’s claim that all leakage belt emissions are due to municipal expansion. This highlights the importance of identifying possible sources of leakage and interrogating the validity of any safeguards employed using external, independent datasets.
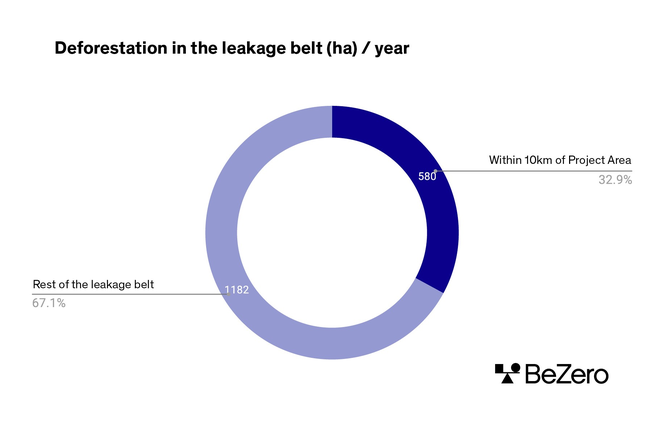
Chart 3: Despite the Brazilian Avoided Deforestation project reporting zero leakage emissions, our Earth Observation analysis suggests that almost 33% of the deforestation in the leakage belt occurred within 10 km of the project boundary, thus undermining the accuracy of the project’s assumptions and disclosures.
2. Case study: Project with “Little Leakage Risks” within NBS
At the other end of the spectrum, a small-scale ARR project in Uganda is deemed to have little leakage risks.
Our top-down analysis indicates that small-scale ARR projects typically have a more positive leakage profile than those of larger-scale plantations, primarily due to these project types aiming to minimise the drivers and scale of potential leakage.
From the bottom-up perspective, leakage risks are further mitigated since farmers participating in the project must demonstrate that project activities will not conflict with their subsistence activities, the main component of which is agricultural production.
The project’s little leakage risks are by its promotion of agroforestry systems, which have significant potential to increase soil organic carbon and thus have positive leakage effects.
3. Case study: Project with “Notable Leakage Risks” within non-NBS
Now taking a look at non-NBS projects, we find an information technology (IT) reuse project in Canada to have notable leakage risks, despite the generally low risks within the Waste sector group.
Akin to many Waste projects, the project assumes zero leakage given the lack of activity displacement. However, our analysis shows that due to the increased efficiency of laptops and liquid crystal displays, refurbishment of old devices can lead to an increase in relative energy expenditures by as much as 300%. Therefore, the project activity has an impact on the IT asset market which can increase emissions through extended use of energy inefficient technology, amounting to notable leakage risks.
4. Case study: Project with “Little Leakage Risks” within non-NBS
The final example is a renewable energy project in the Democratic Republic of Congo (DRC) which has little risk of leakage.
We find minimal risk of activity displacement and associated leakage emissions for renewables projects of this kind due to the scale of upstream carbon emissions relative to the lifetime savings.
Moreover, this project has little risk of market leakage. Although the rebound effect is a potential risk for renewable energy projects in countries with high penetration, for the DRC this risk is unlikely to materialise given the penetration of rural electrification is at 1% or lower. In addition, export of fossil fuels from DRC to all other countries account for less than 0.1% of the global share of fossil fuel trades, equating to a total value of $519m in 2020. This further suggests that rebound effects at the global market scale will be unlikely.
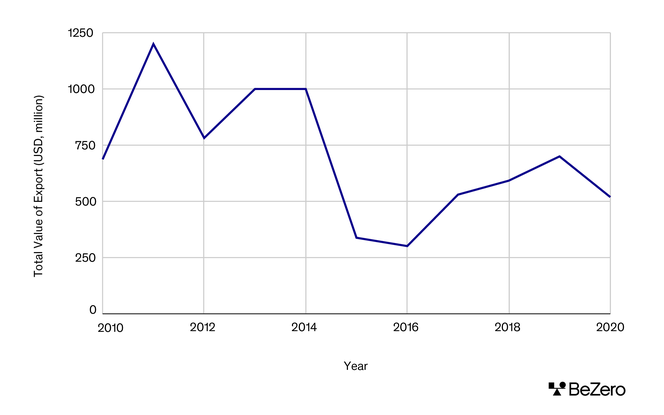
Chart 4: Analysis of the DRC’s fossil fuel trade flows highlights how, despite the country being the fastest growing exporter of fossil fuels in Sub-Saharan Africa (9% growth between 2015-2020), this trade flow accounts for less than 0.1% of the global share and thus negates market leakage risks.
Finally, our project-specific analysis also assesses leakage risks to be limited given that project activities enable isolated mini-grids. These are systems that are not connected to national infrastructure and will therefore not lead to displacement effects in the national grid.
Conclusion
The likelihood of emissions avoided or removed by a project being pushed outside its boundaries is an important factor when assessing a credit’s level of carbon efficacy. Assessing both the top-down and project-specific leakage risks forms a key part of our BCR framework.
Our assessment of leakage risks looks at both the possible sources of leakage and any safeguards put in place by a project to mitigate them. Our approach leverages a number of datasets and information sources to incorporate from a global market level down to project-specific factors.
The two forms of leakage - market leakage and activity displacement - can materialise in different ways, depending on a project’s sector. In general, NBS projects are subject to risks from both sources, whereas non-NBS projects typically do not face risks of activity displacement. The important caveat here is that cookstove projects face risks of traditional, highly-emitting stoves being displaced beyond their boundaries.
Thus, barring the Household Devices sector group, we find that NBS projects commonly hold higher risks of leakage than non-NBS initiatives. This is likely due to the greater scope of possible leakage sources, in addition to the difficulty in estimating an accurate leakage belt.
Leakage risks must be considered on a project by project basis, with assessments of both top-down and bottom-up risks, alongside project-specific safeguards. Only when such a holistic approach is employed can leakage risks be comprehensively evaluated and compared across different sectors, with the benefit of promoting fungibility within the market.
Reviews and updates
| Version | Date | Description |
|---|---|---|
| 1.0 | 01/09/22 | Initial release |
| 1.1 | 10/02/23 | Inclusion of updated information on non-NBS components |