
BeZero’s carbon risk factor series: Additionality
Members of the BeZero Carbon Ratings team, led by Dr Kirti Ramesh, leverage BeZero’s database of rated carbon credit projects to explore how additionality is assessed in accreditation, and in the BeZero Carbon Ratings framework. They explain why having a better understanding of Additionality is critical for all market participants to assess the quality of a carbon credit.
Here are some key takeaways
Additionality tests are fundamental to accrediting and rating carbon credit projects.
Eight explicit, and two implicit, methods are used to assess additionality across BeZero’s universe of rated carbon credit projects.
How additionality tests are applied and evidenced by the projects is what matters.
Contents
- What is additionality?
- How do Standards Bodies test for Additionality?
- The who’s who of Additionality tests
- Mapping Additionality tests in the VCM
- The quantity or type of test applied does not explain project quality
- How BeZero assesses Additionality
- Case Study: small scale hydro-electric dam projects
- Additionality tests show that quality isn’t actually binary, it is a spectrum
- Conclusion
What is additionality?
Additionality is “the risk that a credit purchased and retired does not lead to a tonne of CO₂e being avoided or sequestered that would not have otherwise happened”.
Standards Bodies require the application of additionality tests to assess if carbon finance plays a decisive role in initiating project activities. Additionality is one of BeZero’s three qualifying criteria for rating a project, and it ranks as the largest weighted risk factor in the BeZero Carbon Ratings framework.
How do Standards Bodies test for Additionality?
Standards Bodies, such as the Gold Standard, Verra, and the American Carbon Registry, treat testing for Additionality as a binary. Either the carbon reduced or removed by a project would have happened without the project going ahead, or it would not have. They also rely on what’s known as a threshold analysis. Accreditation requires that a project has passed one or more tests set out by the methodology, rather than the extent to which the project passes the test(s).
This is a necessary part of the market mechanism. Additionality must be treated as binary to result in the issuance of whole units of carbon credits - otherwise they could never be traded or retired. You cannot issue or trade error bands or probabilities. However, as we show later, this is only half of the story.
The who’s who of Additionality tests
In today’s VCM, we find at least eight explicit, and two implicit, methods used to assess Additionality across our universe of rated projects. Table 1 below shows the major methods by which Additionality is assessed in our current universe of over 240 rated projects.
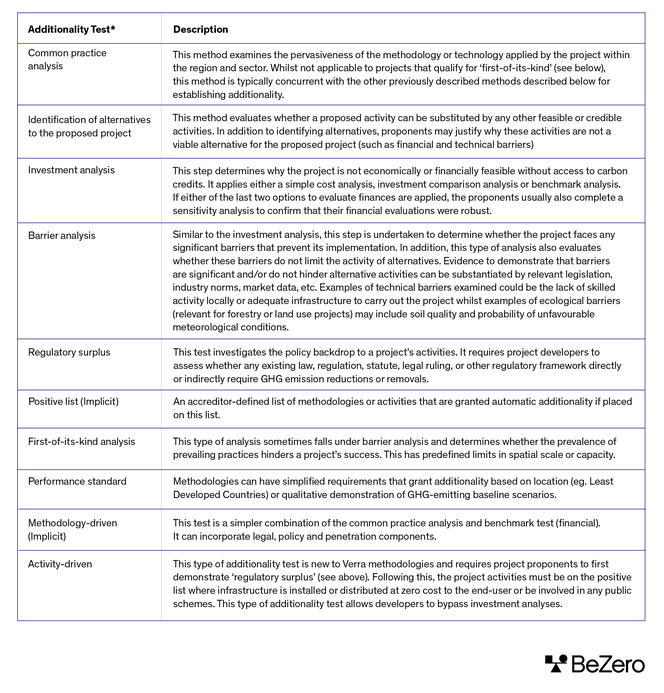
*The methods and explanations have been compiled through the BeZero Carbon Rating team’s analysis of various market tools and verified methodologies to assess additionality.
Mapping Additionality tests in the VCM
BeZero has currently rated more than 360 carbon projects across all sector groupings, the world’s largest database of carbon-only ratings. We leverage this database to explore the trends across Additionality tests in the VCM.
The first chart shows that the three most commonly applied tests account for ~70% of tests across the dataset; common practice analysis, identification of alternatives to the proposed project and investment analysis. The least prevalent are methodology-driven and activity-driven tests.
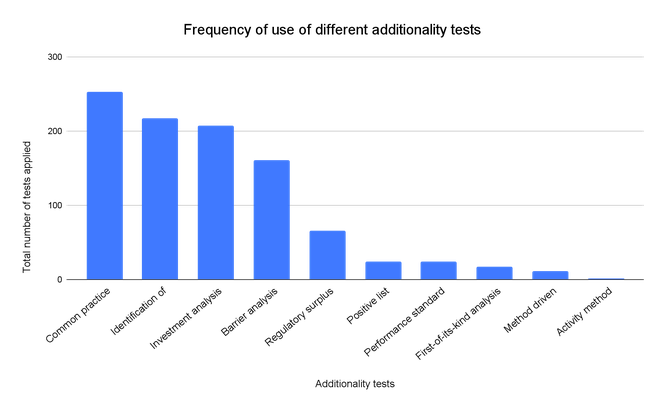
Chart 1. The frequency of use of the different additionality tests in the BeZero Carbon Rated universe of projects (based on data at time of publication).
We then consider the distribution of additionality tests per rated project. We find the most tests applied to a single project is five (4 projects) and the fewest is one, which is the case for 56 projects. The median number of tests applied per project is 3, reflecting the fact that 182 projects (50% of sample size) have three additionality tests per project. The average across the dataset is slightly lower at 2.7 given there are 300 projects that have three or fewer tests applied.
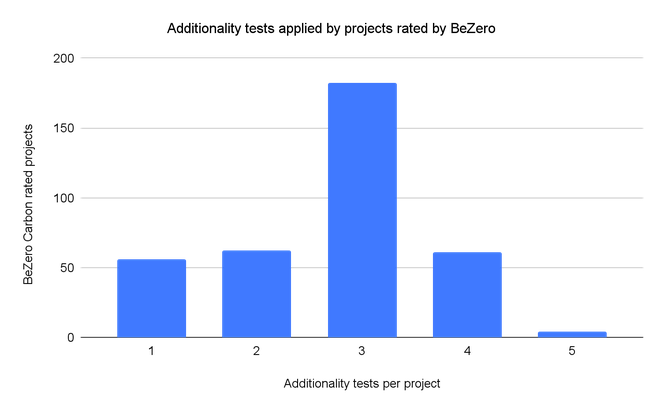
Chart 2. The number of additionality tests applied by projects rated by BeZero
Layering in the BeZero Carbon Sector Classification System reveals considerable dispersion across the different VCM sector groupings. At the broader Sector level, our projects rated in our database, we find that Engineered Carbon Removals (only 1 project) and Nature Based Solutions have the most additionality tests on average across the projects (3 per project), whereas Household Devices has the fewest (1-2 per project).
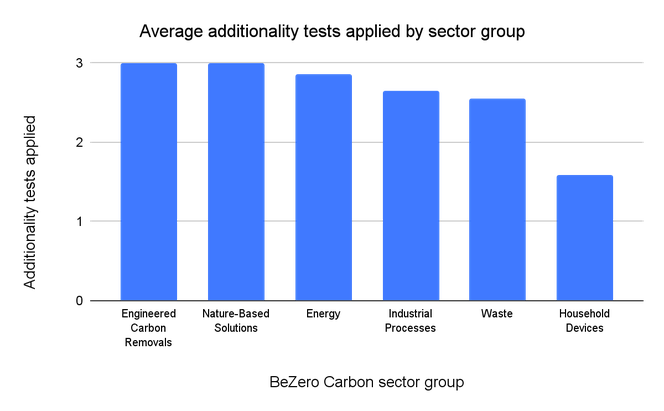
Chart 3. The average number of additionality tests applied across all rated projects, according to the BeZero Carbon Rating Sector classification. (N.B. Transport is classified as a Sector within the Industrial Processes Sector Group: as an outlier for the number of additionality tests used, it has been excluded from Industrial Processes in this Chart).
We extend this analysis to 34 sub-sectors and find that the lowest average number of tests is Residential Heating & Cooling and Soil-Related Agricultural Practices, whereas Transport Infrastructure & Management has the highest (note these sub-sectors have a small sample of rated projects). Nature Based Solutions and Industrial Processes, which have the highest number of sub-sectors, trends towards three tests across the board but this masks a large variation between Peatland and Soil-Related Agricultural Practices for Nature Based Solutions and between Transport Infrastructure & Management and Transport Fuel & Efficiency for Industrial Processes.
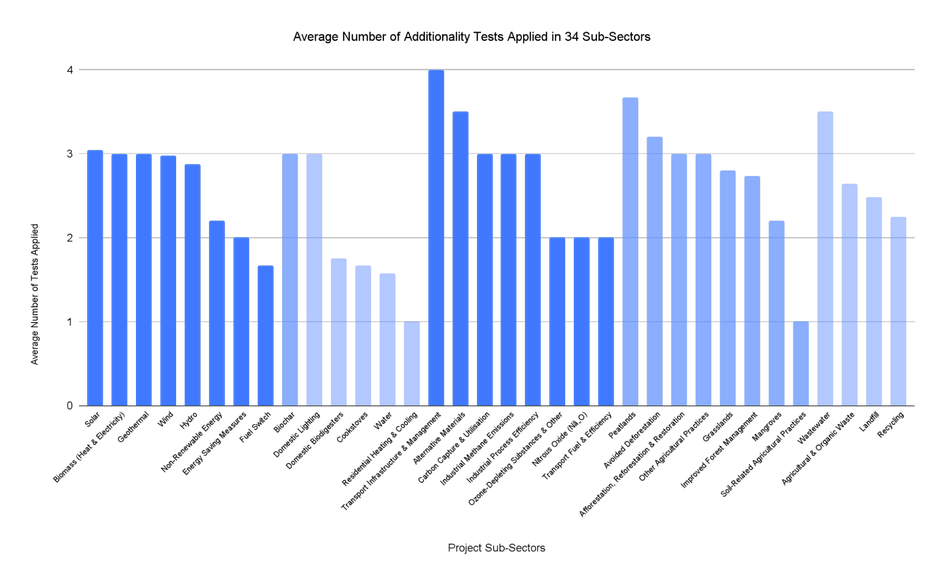
Chart 4. The average number of additionality tests applied by projects in 34 sub-sectors of the BeZero Carbon Sector Classification.
Clear differences also emerge when we compare the number of Additionality tests by the Standards Body. Chart 5 reveals a marked difference between the two largest US-based registries: American Carbon Registry has the second highest average number of additionality tests, while Climate Action Reserve has the fewest.
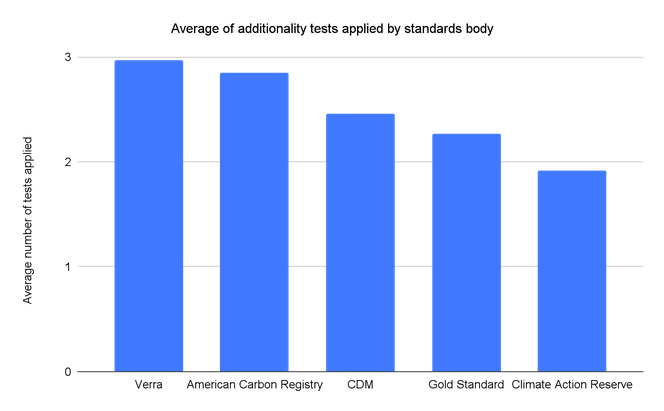
Chart 5. The average number of additionality tests applied by standards body, across the BeZero Carbon rated universe (over 350 projects at time of publication).
Finally, we observe a notable difference between the project types. Projects classified as “avoidance” have an average of 2.7 additionality tests per project compared to 3.0 tests for those classified as “removals”. Projects where we observe evidence of both removal and avoidance activities have an average of 2.9 tests.
The quantity or type of test applied does not explain project quality
Despite the considerable variation, we find little relationship between the type of additionality test applied and a project’s rating. Chart 6 shows a simple analysis looking at the number of additionality tests applied by a project and its rating. The range between ratings is very low, 0.6, with the highest 3 and lowest 2.4 tests per project covered in this analysis.
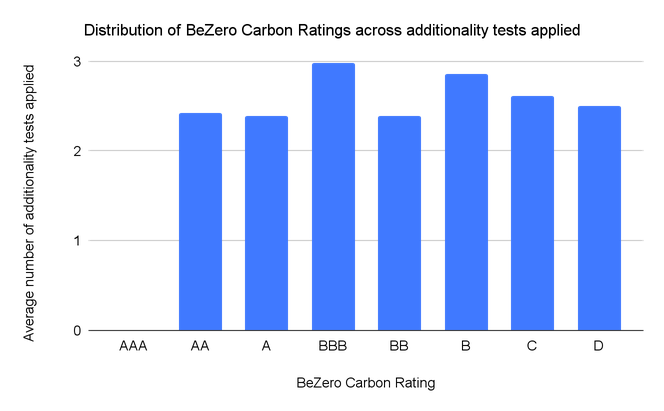
Chart 6. The number of additionality tests applied by a project do not determine the quality of credits issued.
A similar picture emerges by assessing the ratings distribution for the five most commonly used additionality tests across our dataset. Chart 7 shows a slight positive skew for those projects using the ‘regulatory surplus’ or ‘barrier analysis’ tests. But overall each test shows a similar distribution to the total sample.
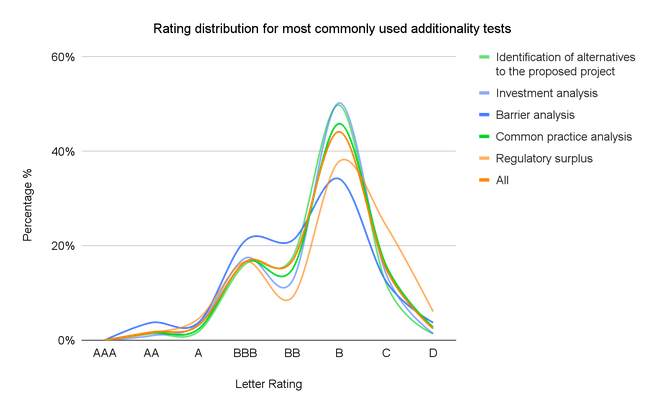
Chart 7. Ratings distribution for the five most commonly used additionality tests and the full sample of ratings (‘All’).
How BeZero assesses Additionality
In the absence of a clear trend across Additionality tests, the BeZero Carbon Ratings team undertakes its own research to assess Additionality and how it relates to the quality of carbon credit projects.
The Ratings team starts by interrogating the appropriateness of the additionality tests applied and identifying any limitations to the tools used to implement or evidence them by the developer. These may include the area used, or the types of comparisons made when gauging common practice.
Following this, the team seeks to corroborate the validity of the data underlying a project’s additionality assessment using independent data sources, industry data, peer reviewed research and in-house expertise. Factors assessed include reported internal rates of return, penetration of technology or trends of investment and capital flow prior to project implementation among others.
Our assessments of Additionality take into account variables beyond the project boundaries and what the project self-reports. Inputs include the presence of global or national barriers to project delivery, the role of carbon finance in the overall revenue stream, and the effectiveness of policy instruments and governance for either pre-existing conservation or decarbonisation practices.
Case Study: small scale hydro-electric dam projects
To illustrate BeZero’s analysis in action, the team has summarised a comparison of VCS 1716 - an isolated mini-grid project in the Democratic Republic of Congo (DRC); and VCS 1241 - a small-scale hydropower project in India. The two projects outwardly appear very similar. Both are accredited by Verra, both are within the Renewables sub-sector, and both are small-scale. Yet, a better understanding of the underlying application and substantiation of the projects’ Additionality tests reveals considerable differences and are an important factor in explaining why VCS 1716 is rated BBB compared to VCS 1241, which is rated B.
Methods: VCS 1716 uses the positive list to determine Additionality due to its small-scale - this test is only suitable for projects that generate less than 15MW - and the low rates of rural electricity access in the DRC. Our analysis of the evidence substantiates the project’s eligibility against this criteria. For example, despite their potential small-scale, programmes such as these are largely neglected in the DRC and access to external finance is scarce and costly. By comparison, VCS 1241 performs an investment analysis to gauge additionality against a benchmark internal rate of return of 11.75% (without inflation). Our research suggests that using this type of CDM investment analysis tool carries considerable risks, such as relying on outdated investment benchmarks and subjectivity around future costs, expected electricity tariffs and the role of subsidies.
Independent data: One example data source the team utilises when assessing renewable projects are local, regional or national electricity records. Access rates diverge materially between the two projects. The team’s analysis of access to electricity in rural DRC, where VCS 1716 is located, corroborates the project’s claim of low electricity penetration. We find that at the start of the project, only 1% of the target population had access to electricity. Conversely, access to electricity at the start of the VCS 1241 in India was close to 80% and we find that the benchmark internal rates of return for such projects to be higher than those reported by the project – at 14% at the start of the project.
Role of carbon finance: One area of similarity between projects is the role of carbon finance. Our analysis indicates that the sale of electricity is significant for both projects, contributing to more than 98% of their overall revenue streams. High non-carbon revenues are a common caveat when considering Additionality for all Renewables projects in general. That said, the team still finds a key difference across VCS 1716 and VCS 1241. Sector-based concerns about low Additionality are mitigated by the fact that there are significant barriers in the valuation of electricity in the DRC. For example, on-the-ground data reveal that only 42% of the electricity generated is paid for by an end-user due to transmission losses and non-payments of bills. No such mitigating factors are found for VCS 1241.
Beyond project reporting: The role of policy instruments and local governance is also an important extension of our additionality analysis where we find disparate additionality risks for the two projects. In the DRC, electricity development is reliant on external capital and data indicate that development of infrastructure is estimated to cost 30% of the nation’s GDP. In contrast, capital subsidies in India have been observed to routinely increase equity internal rates of return beyond benchmarks for small hydropower projects. Further, in the state of Maharashtra, where VCS 1241 is located, small hydropower is prevalent and four years prior to the project, over 10% of the national capacity was met.
Additionality tests show that quality isn’t actually binary, it is a spectrum
The above case study shows that serious differences exist between how a project implements Additionality tests and the context within which the project operates. It also shows that one cannot judge carbon credit quality merely by having a better understanding of the quantity of tests or simply by choosing one Additionality test over another.
Additionality tests function like a confidence interval. It is only possible to have more or less confidence that a project is additional based on the information and data available on the factors such as the project type, the country it is in, the financing dynamics and others.
At its core, this is because testing for Additionality fundamentally relies on a counterfactual that can never be observed. One cannot say with complete certainty that a project is 100% additional as we will never have the data point to make that claim.
This vital distinction between theory and reality underpins the difference between Additionality tests for accreditation and Additionality as a metric to assess carbon credit quality.
Conclusion
Additionality tests are the keystone of a carbon credit project, a qualifying criteria for BeZero Carbon Ratings and the largest weighted of all six risk factors. They allow credits to be issued and are what differentiates a carbon credit project from other forms of green finance.
But treating Additionality as binary is too simplistic. Our research shows that substantial differences exist between how they are applied across different types of projects, even those within the same sub-sector that appear extremely similar. Understanding these differences, embracing them, and allowing market participants to make decisions based on them is a crucial part of the VCM’s next phase of evolution.
The more projects disclose the details on which Additionality tests they’ve applied and how they evidenced them, the better market participants can assess and explore differences in quality, and the faster the market can scale with the best projects commanding the highest prices and attracting the most investment.